

Question: Based on the pivot table above Is the calculation of Net Pay correct? Are the figures in this table correct? Are any problems with the
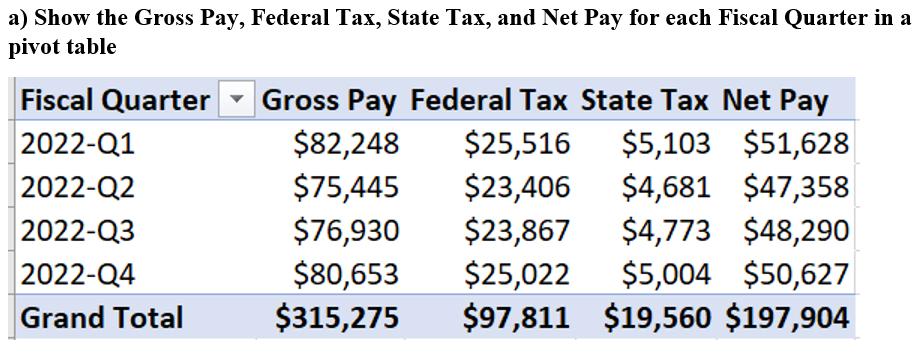
Based on the pivot table above Is the calculation of Net Pay correct? Are the figures in this table correct? Are any problems with the data shown in this pivot table? If so, what are they?
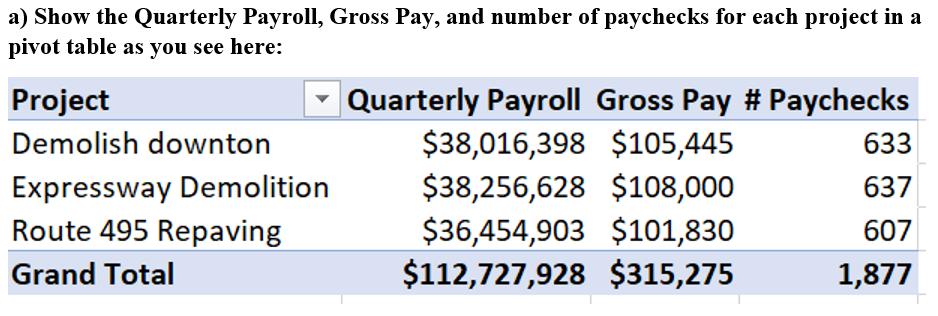
Based on the pivot table above Is the total payroll within budget? Are the figures in this table correct? Are any problems with the data shown in this pivot table? If so, what are they?
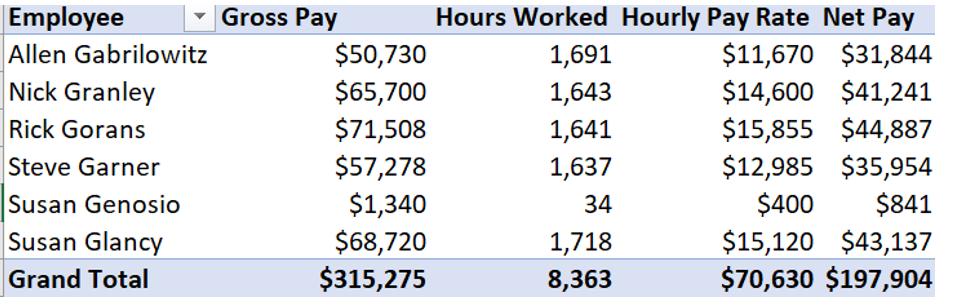
 based on the pivot table above Are these figures correct? Are there any problems with the data shown in this pivot table? If so, what are they?
a) Show the Gross Pay, Federal Tax, State Tax, and Net Pay for each Fiscal Quarter in a pivot table Fiscal Quarter 2022-Q1 2022-Q2 2022-Q3 2022-Q4 Grand Total Gross Pay Federal Tax State Tax Net Pay $25,516 $5,103 $51,628 $23,406 $4,681 $47,358 $23,867 $4,773 $48,290 $25,022 $5,004 $50,627 $97,811 $19,560 $197,904 $82,248 $75,445 $76,930 $80,653 $315,275
Step by Step Solution
3.40 Rating (147 Votes )
There are 3 Steps involved in it
To determine if the calculations are correct and whether there are any problems with the data in these pivot tables lets analyze them one by one First ... View full answer

Get step-by-step solutions from verified subject matter experts