

Answered step by step
Verified Expert Solution
Question
1 Approved Answer
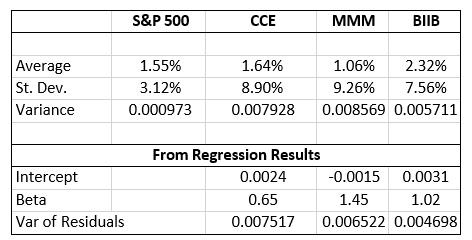
Based on the table above, what is the proportion of the total risk for BIIB that can be explained by the market driven risk? A.
- Based on the table above, what is the proportion of the total risk for BIIB that can be explained by the market driven risk?
A. 54%
B. 48%
C. 18%
D. 7%
Step by Step Solution
There are 3 Steps involved in it
Step: 1

Get Instant Access to Expert-Tailored Solutions
See step-by-step solutions with expert insights and AI powered tools for academic success
Step: 2

Step: 3
Ace Your Homework with AI
Get the answers you need in no time with our AI-driven, step-by-step assistance
Get Started
Research In Finance
Authors: John W. Kensinger
1st Edition
0857245414, 978-0857245410