

Answered step by step
Verified Expert Solution
Question
1 Approved Answer
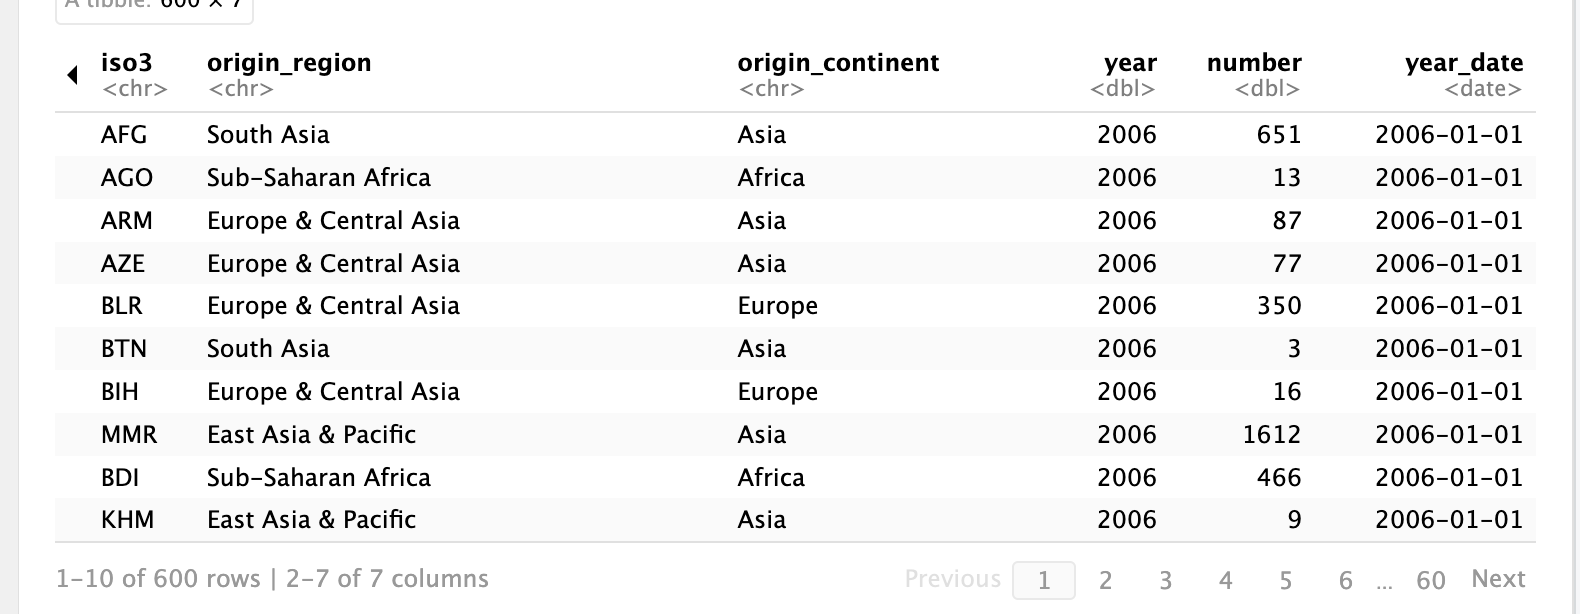
based on this code and dataset: # Load required packages library ( dplyr ) library ( countrycode ) library ( lubridate ) library ( tidyr
based on this code and dataset: # Load required packages
librarydplyr
librarycountrycode
librarylubridate
librarytidyr
librarytidyverse
# Load the data
df read.csv~DocumentsR and RstudioA: RefugeesdataArefugeestatus.csv
refugeesraw readcsv~DocumentsR and RstudioA: RefugeesdataArefugeestatus.csv na cXD
noncountries cAfrica "Asia", "Europe", "North America", "Oceania",
"South America", "Unknown", "Other", "Total"
refugeesclean refugeesraw
# Make this column name easier to work with
renameorigincountry ContinentCountry of Nationality
# Get rid of noncountries
filterorigincountry in noncountries
# Convert country names to ISO codes
mutateiso countrycodeorigincountry, "country.name", "isoc
custommatch cKorea North" PRK
# Convert ISO codes to country names, regions, and continents
mutateorigincountry countrycodeiso "isoc "country.name"
originregion countrycodeiso "isoc "region"
origincontinent countrycodeiso "isoc "continent"
# Make this data tidy
gatheryear number, origincountry, isooriginregion, origincontinent
# Make sure the year column is numeric make an actual date column for years
mutateyear asnumericyear
yeardate ymdpasteyear
refugeesclean
refugeescountriescumulative refugeesclean
arrangeyeardate
groupbyorigincountry
mutatecumulativetotal cumsumnumber
refugeescountriescumulative
refugeescontinents refugeesclean
groupbyorigincontinent, yeardate
summarizetotal sumnumber narm TRUE
refugeescontinentscumulative refugeesclean
groupbyorigincontinent, yeardate
summarizetotal sumnumber narm TRUE
arrangeyeardate
groupbyorigincontinent
mutatecumulativetotal cumsumtotal
create graphs to support this story:
From to the United States opened its arms to over refugees, showcasing its longstanding dedication to offering refuge to those escaping peril. This intricate mosaic of fluctuating trends, reflecting the geopolitical upheavals and humanitarian crises shaping our world during this period, extends far beyond a mere collection of numbers.
Myanmar's Surge and Retreat MMR
In Myanmar, the sharp increase in refugees circa aligns with Cyclone Nargis's devastating impact. The tragedy spurred a significant humanitarian crisis, propelling a wave of displacement. Fast forward to and we witness another peak. Here, the ongoing ethnic conflicts, a longstanding source of distress, likely drove another exodus, reflecting the nation's turbulent journey.
Iraq's Escalating Exodus IRQ
Turning to Iraq, a gradual yet steady rise in refugees culminates in a spike around This pattern echoes the enduring instability and conflict following the Iraq War, with the emergence of ISIS around exacerbating the situation, compelling many to flee their homeland in search of safety.
Bhutan's Peaks of Departure BTN
The story of Bhutanese refugees, marked by peaks in and harks back to the ethnic Nepalis' displacement in the early s The persistence of this refugee wave underscores the protracted nature of their plight, with many spending years in Nepalese camps before finding resettlement.
Interpreting the Ebb and Flow
These graphical trends mirror pivotal historical events, offering insights into the causes behind the refugee movements. While spikes in the graph suggest periods of intensified crisis, the subsequent declines often coincide with stabilization efforts or successful asylum in host nations.
Policy Reflections and Humanizing Data
The fluctuations also mirror policy changes and international diplomacy's ebb and flow, affecting refugees' journeys to safety. However, beyond the graph lines and data points lies the core human narrativethe uprooted families, the resilience amid tribulations, and the ongoing search for a home.
The Chronicles of Refuge and Resilience
Our exploration of the leading refugeeorigin countries over a decade paints a vivid picture of global unrest and the unyielding spirit of humanity. More than a statistical chart, this visual narrative stands as a testament to our era, emphasizing the ongoing need for empathy and support for those who continue to seek a new life in the United States.
Step by Step Solution
There are 3 Steps involved in it
Step: 1

Get Instant Access to Expert-Tailored Solutions
See step-by-step solutions with expert insights and AI powered tools for academic success
Step: 2

Step: 3
Ace Your Homework with AI
Get the answers you need in no time with our AI-driven, step-by-step assistance
Get Started
Database Systems For Advanced Applications Dasfax 2009 International Workshops Benchmark Mcis Wdpp Ppda Mbc Phd Brisbane Australia April 2009 Lncs 5667
Authors: Lei Chen ,Chengfei Liu ,Qing Liu ,Ke Deng
2009th Edition
364204204X, 978-3642042041