Answered step by step
Verified Expert Solution
Link Copied!

Question

1 Approved Answer

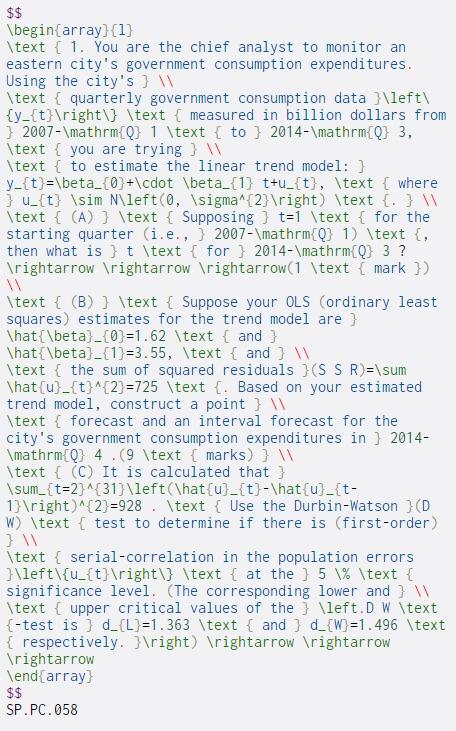
$$ begin{array}{1} text { 1. You are the chief analyst to monitor an eastern city's government consumption expenditures. Using the city's } text { quarterly

image text in transcribed

$$ \begin{array}{1} \text { 1. You are the chief analyst to monitor an eastern city's government consumption expenditures. Using the city's } \text { quarterly government consumption data }\left\ {y_{t} ight\} \text { measured in billion dollars from } 2007-\mathrm{Q} 1 \text { to } 2014-\mathrm{Q} 3, \text { you are trying } W \text { to estimate the linear trend model: } y_{t}=\beta_{0}+\cdot \beta_{1} t+u_{t}, \text { where } u_{t} \sim N\left(0, \sigma^{2} ight) \text {. } W \text { (A) } \text { Supposing ) t=1 \text { for the starting quarter (i.e., ] 2007-\mathrm{Q} 1) \text {, then what is } t \text {for } 2014-\mathrm{Q} 3 ? ightarrow ightarrow ightarrow(1 \text { mark }) \text { (B) } \text { Suppose your OLS (ordinary least squares) estimates for the trend model are } That{\beta}_{0}=1.62 \text { and } \hat{\beta}_{1}=3.55, \text { and } \text { the sum of squared residuals }(SSR)=\sum \hat{u}_{t}^{2}=725 \text {. Based on your estimated trend model, construct a point } W \text { forecast and an interval forecast for the city's government consumption expenditures in } 2014- \mathrm{Q} 4.(9 \text { marks)} \text { (C) It is calculated that } \sum_{t=2}^{31}\left(\hat{u}_{t}-\hat{u}_{t- 1} ight)^{2}=928 \text { Use the Durbin-Watson }(D W \text { test to determine if there is (first-order) } \text { serial-correlation in the population errors }\left\{u_{t} ight\} \text { at the } 5 % \text { significance level. The corresponding lower and } \ \text { upper critical values of the } \left.D W \text {-test is ) d_{L)=1.363 \text { and ) d_{W}=1.496 \text { respectively. } ight) ight rrow ightarrow ightarrow \end{array} $$ SP.PC.058

Step by Step Solution

There are 3 Steps involved in it

Step: 1

blur-text-image

Get Instant Access to Expert-Tailored Solutions

See step-by-step solutions with expert insights and AI powered tools for academic success

Step: 2

blur-text-image

Step: 3

blur-text-image

Ace Your Homework with AI

Get the answers you need in no time with our AI-driven, step-by-step assistance

Get Started

Recommended Textbook for

Graph Databases

Authors: Ian Robinson, Jim Webber, Emil Eifrem

1st Edition

1449356265, 978-1449356262

More Books

Students also viewed these Databases questions

Question

How do modern Dashboards differ from earlier implementations?

Answered: 1 week ago