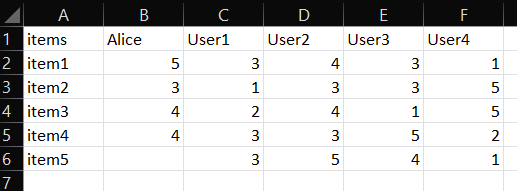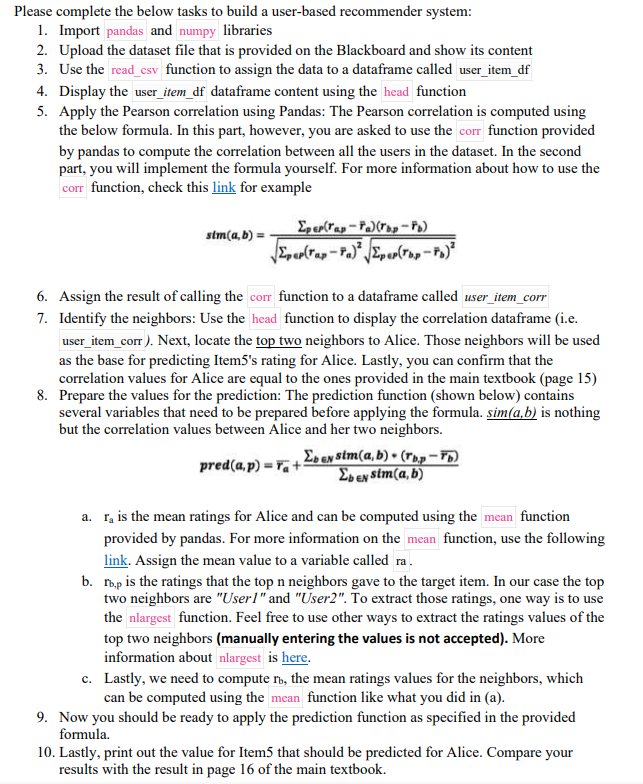

\begin{tabular}{|l|l|r|r|r|r|r|r|} \hline & A & \multicolumn{2}{|c|}{ B } & C & D & E & \multicolumn{1}{|c|}{ F } \\ \hline 1 & items & Alice & User1 & User2 & User3 & User4 \\ \hline 2 & item1 & & 5 & 3 & 4 & 3 & 1 \\ \hline 3 & item2 & & 3 & 1 & 3 & 3 & 5 \\ \hline 4 & item3 & & 4 & 2 & 4 & 1 & 5 \\ \hline 5 & item4 & & 4 & 3 & 3 & 5 & 2 \\ \hline 6 & item5 & & & 3 & 5 & 4 & 1 \\ \hline 7 & & & & & & \end{tabular} Please complete the below tasks to build a user-based recommender system: 1. Import and libraries 2. Upload the dataset file that is provided on the Blackboard and show its content 3. Use the function to assign the data to a dataframe called 4. Display the user_item_df dataframe content using the function 5. Apply the Pearson correlation using Pandas: The Pearson correlation is computed using the below formula. In this part, however, you are asked to use the function provided by pandas to compute the correlation between all the users in the dataset. In the second part, you will implement the formula yourself. For more information about how to use the corr function, check this link for example sim(a,b)=pp(rapFa)2pep(rb,pFb)2pp(rapFa)(rbprb) 6. Assign the result of calling the function to a dataframe called user_item_corr 7. Identify the neighbors: Use the head function to display the correlation dataframe (i.e. . Next, locate the top two neighbors to Alice. Those neighbors will be used as the base for predicting Item5's rating for Alice. Lastly, you can confirm that the correlation values for Alice are equal to the ones provided in the main textbook (page 15) 8. Prepare the values for the prediction: The prediction function (shown below) contains several variables that need to be prepared before applying the formula. sim(a,b) is nothing but the correlation values between Alice and her two neighbors. pred(a,p)=ra+bNsim(a,b)bNsim(a,b)(rb,prb) a. ra is the mean ratings for Alice and can be computed using the function provided by pandas. For more information on the function, use the following link. Assign the mean value to a variable called b. rb,p is the ratings that the top n neighbors gave to the target item. In our case the top two neighbors are "User 1 " and "User 2. To extract those ratings, one way is to use the nlargest function. Feel free to use other ways to extract the ratings values of the top two neighbors (manually entering the values is not accepted). More information about is here. c. Lastly, we need to compute rb, the mean ratings values for the neighbors, which can be computed using the function like what you did in (a). 9. Now you should be ready to apply the prediction function as specified in the provided formula. 10. Lastly, print out the value for Item5 that should be predicted for Alice. Compare your results with the result in page 16 of the main textbook


