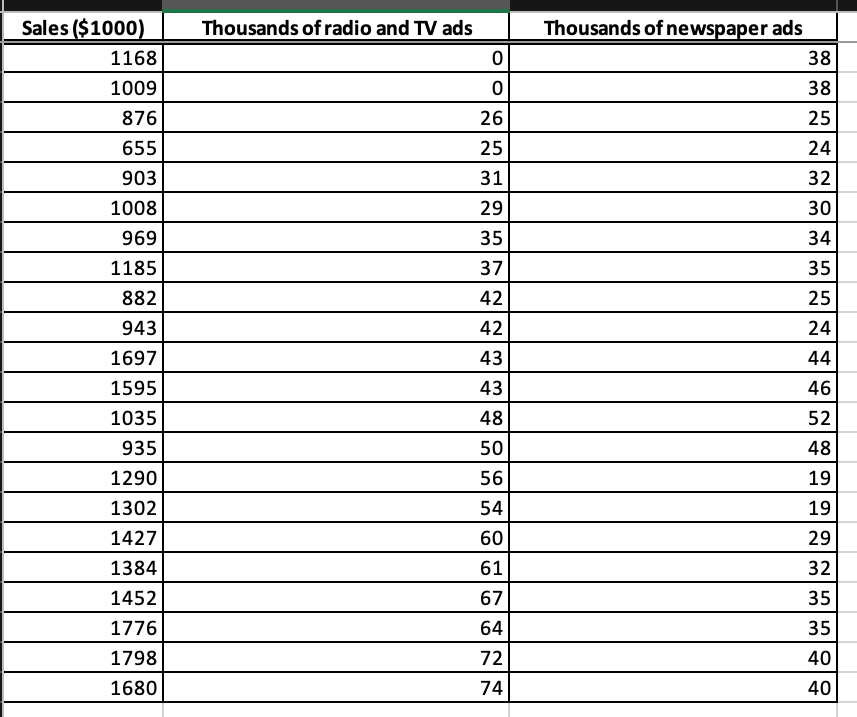
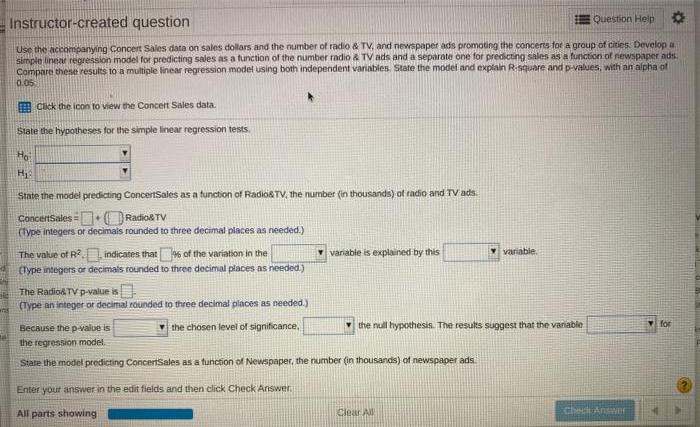
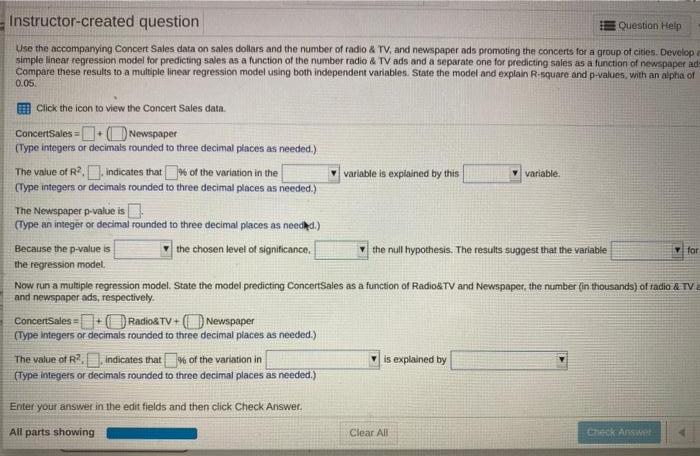

\begin{tabular}{|r|r|r|} \hline Sales (\$1000) & Thousands of radio and TV ads & Thousands of newspaper ads \\ \hline \hline 1168 & 0 & 38 \\ \hline 1009 & 0 & 38 \\ \hline 876 & 26 & 25 \\ \hline 655 & 25 & 24 \\ \hline 903 & 31 & 32 \\ \hline 1008 & 29 & 30 \\ \hline 969 & 35 & 34 \\ \hline 1185 & 37 & 35 \\ \hline 882 & 42 & 25 \\ \hline 943 & 42 & 24 \\ \hline 1697 & 43 & 44 \\ \hline 1595 & 43 & 46 \\ \hline 1035 & 48 & 52 \\ \hline 935 & 50 & 48 \\ \hline 1290 & 56 & 19 \\ \hline 1302 & 54 & 19 \\ \hline 1427 & 60 & 29 \\ \hline 1384 & 61 & 32 \\ \hline 1452 & 67 & 35 \\ \hline 1776 & 64 & 40 \\ \hline 1798 & 72 & 40 \\ \hline 1680 & 45 & 40 \\ \hline \end{tabular} Usc the accompanying Concert Sales data on sales dollars and the number of radio \& TV, and newspaper ads promoting the concers tor a group of cities Devolop a simpto linear regression model for predicting sales as a tunction of the number radio z TV ads and a separote one for predctng sales as a function of rewspaper adt. Compare these results to a multiple linear regression modet using both independent vanibles. State the model and explali R-square and p-values, with an alpha of cuck the icon to view the Concert Sales data. State the hypotheses for the simple linear regression tests. State the model predicting ConcertSales as a function of RadiostV, the number (in thousands) of tadio and TV ads. coactisaies = Radios TV (type integers or decimals rounded to three decimal places as needed. The value of R2 - indicates that os of the variation in the variable is explained by this variable. (Hype insepers or decimals rounded to three decimal places as needed) The Radiod TV p-value is (Type an integer or decimal founded to three decimal ploces as needed.) Because the p valise is the chosen level of significance, the nul hypothesis. The resuls suggest that the variable: the regression model. Stare the modcl predicting Concentsales as a function of Newspaper, the number (in thousands) of newspaper ads Enter yout answer in the edit fields and then click Check Answer: Use the accompanying Concert Sales data on sales dollars and the number of radio \& TV, and newspaper ads promoting the concerts for a group of cities. Develop i simple linear regression model for predicting sales as a function of the number radio \& TV ads and a separate one for predicting sales as a function of newspaper ad Compare these results to a multiple linear regression model using both independent variabies. State the model and explain R-souare-and p-values. with an a.pha of 0.05. Click the icon to view the Concert Sales data ConcertSales = Newspaper (Type integers or decimals tounded to three decimal piaces as needed.) The value of R2. indicates that . of the variation in the (Type integers or decimals rounded to three decimal places as needed.) The Newspaper p-value is (Type an integer or decimal rounded to three decimal places as need.d.) Because the p-value is the chosen level of significance, the null hypothesis. The results suggest that the variable the regression model Now run a multiple regression model. State the model predicting ConcertSales as a function of Radio\&TV and Newspaper, the number (in thousands) of radio \& TV and newspoper ads, respectively. ConcertSales =+ Radio\&TV + Newspaper (Type integers or decimals rounded to three decimal piaces as needed.) The value of R2. indicates that . of the variation in is expianed by (Type integers or decimals sounded to three decimal places as needed.) Enter your answer in the edit fields and then click Check Answet. (Type integers or decimals rounded to three decimal places as needed.) The Radio\&TV p-value is (Type an integer or decimal rounded to three decimal places as needed.) The Newspaper p-value is (Type an integer or decimal rounded to three decimal places as needed.) Enter your answer in the edit fields and then click Check Answer. \begin{tabular}{|r|r|r|} \hline Sales (\$1000) & Thousands of radio and TV ads & Thousands of newspaper ads \\ \hline \hline 1168 & 0 & 38 \\ \hline 1009 & 0 & 38 \\ \hline 876 & 26 & 25 \\ \hline 655 & 25 & 24 \\ \hline 903 & 31 & 32 \\ \hline 1008 & 29 & 30 \\ \hline 969 & 35 & 34 \\ \hline 1185 & 37 & 35 \\ \hline 882 & 42 & 25 \\ \hline 943 & 42 & 24 \\ \hline 1697 & 43 & 44 \\ \hline 1595 & 43 & 46 \\ \hline 1035 & 48 & 52 \\ \hline 935 & 50 & 48 \\ \hline 1290 & 56 & 19 \\ \hline 1302 & 54 & 19 \\ \hline 1427 & 60 & 29 \\ \hline 1384 & 61 & 32 \\ \hline 1452 & 67 & 35 \\ \hline 1776 & 64 & 40 \\ \hline 1798 & 72 & 40 \\ \hline 1680 & 45 & 40 \\ \hline \end{tabular} Usc the accompanying Concert Sales data on sales dollars and the number of radio \& TV, and newspaper ads promoting the concers tor a group of cities Devolop a simpto linear regression model for predicting sales as a tunction of the number radio z TV ads and a separote one for predctng sales as a function of rewspaper adt. Compare these results to a multiple linear regression modet using both independent vanibles. State the model and explali R-square and p-values, with an alpha of cuck the icon to view the Concert Sales data. State the hypotheses for the simple linear regression tests. State the model predicting ConcertSales as a function of RadiostV, the number (in thousands) of tadio and TV ads. coactisaies = Radios TV (type integers or decimals rounded to three decimal places as needed. The value of R2 - indicates that os of the variation in the variable is explained by this variable. (Hype insepers or decimals rounded to three decimal places as needed) The Radiod TV p-value is (Type an integer or decimal founded to three decimal ploces as needed.) Because the p valise is the chosen level of significance, the nul hypothesis. The resuls suggest that the variable: the regression model. Stare the modcl predicting Concentsales as a function of Newspaper, the number (in thousands) of newspaper ads Enter yout answer in the edit fields and then click Check Answer: Use the accompanying Concert Sales data on sales dollars and the number of radio \& TV, and newspaper ads promoting the concerts for a group of cities. Develop i simple linear regression model for predicting sales as a function of the number radio \& TV ads and a separate one for predicting sales as a function of newspaper ad Compare these results to a multiple linear regression model using both independent variabies. State the model and explain R-souare-and p-values. with an a.pha of 0.05. Click the icon to view the Concert Sales data ConcertSales = Newspaper (Type integers or decimals tounded to three decimal piaces as needed.) The value of R2. indicates that . of the variation in the (Type integers or decimals rounded to three decimal places as needed.) The Newspaper p-value is (Type an integer or decimal rounded to three decimal places as need.d.) Because the p-value is the chosen level of significance, the null hypothesis. The results suggest that the variable the regression model Now run a multiple regression model. State the model predicting ConcertSales as a function of Radio\&TV and Newspaper, the number (in thousands) of radio \& TV and newspoper ads, respectively. ConcertSales =+ Radio\&TV + Newspaper (Type integers or decimals rounded to three decimal piaces as needed.) The value of R2. indicates that . of the variation in is expianed by (Type integers or decimals sounded to three decimal places as needed.) Enter your answer in the edit fields and then click Check Answet. (Type integers or decimals rounded to three decimal places as needed.) The Radio\&TV p-value is (Type an integer or decimal rounded to three decimal places as needed.) The Newspaper p-value is (Type an integer or decimal rounded to three decimal places as needed.) Enter your answer in the edit fields and then click Check