Question
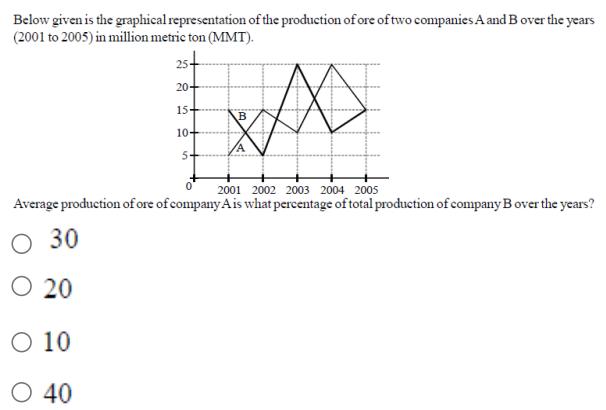
Below given is the graphical representation of the production of ore of two companies A and B over the years (2001 to 2005) in

Below given is the graphical representation of the production of ore of two companies A and B over the years (2001 to 2005) in million metric ton (MMT). 25+ 20- 15+ 10+ 5+ B 2001 2002 2003 2004 2005 Average production of ore of company A is what percentage of total production of company B over the years? O 30 O 20 O 10 O 40
Step by Step Solution
There are 3 Steps involved in it
Step: 1
The detailed ...
Get Instant Access to Expert-Tailored Solutions
See step-by-step solutions with expert insights and AI powered tools for academic success
Step: 2

Step: 3

Ace Your Homework with AI
Get the answers you need in no time with our AI-driven, step-by-step assistance
Get StartedRecommended Textbook for
Statistics The Exploration & Analysis Of Data
Authors: Roxy Peck, Jay L. Devore
7th Edition
0840058012, 978-0840058010
Students also viewed these Physics questions
Question
Answered: 1 week ago
Question
Answered: 1 week ago
Question
Answered: 1 week ago
Question
Answered: 1 week ago
Question
Answered: 1 week ago
Question
Answered: 1 week ago
Question
Answered: 1 week ago
Question
Answered: 1 week ago
Question
Answered: 1 week ago
Question
Answered: 1 week ago
Question
Answered: 1 week ago
Question
Answered: 1 week ago
Question
Answered: 1 week ago
Question
Answered: 1 week ago
Question
Answered: 1 week ago
Question
Answered: 1 week ago
Question
Answered: 1 week ago
Question
Answered: 1 week ago
Question
Answered: 1 week ago
Question
Answered: 1 week ago
Question
Answered: 1 week ago
Question
Answered: 1 week ago
Question
Answered: 1 week ago
View Answer in SolutionInn App


