Answered step by step
Verified Expert Solution
Question
1 Approved Answer
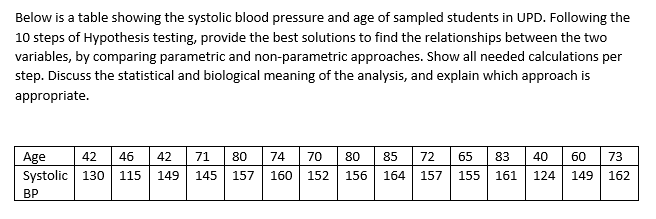
Below is a table showing the systolic blood pressure and age of sampled students in UPD. Following the 10 steps of Hypothesis testing, provide the
Below is a table showing the systolic blood pressure and age of sampled students in UPD. Following the 10 steps of Hypothesis testing, provide the best solutions to find the relationships between the two variables, by comparing parametric and non-parametric approaches. Show all needed calculations per step. Discuss the statistical and biological meaning of the analysis, and explain which approach is appropriate

Step by Step Solution
There are 3 Steps involved in it
Step: 1

Get Instant Access to Expert-Tailored Solutions
See step-by-step solutions with expert insights and AI powered tools for academic success
Step: 2

Step: 3

Ace Your Homework with AI
Get the answers you need in no time with our AI-driven, step-by-step assistance
Get Started


