Question
Below is financial information for a McDonalds case Analysis. Also some ratios I calculated. Question: From my calculations, will it be true to conclude that
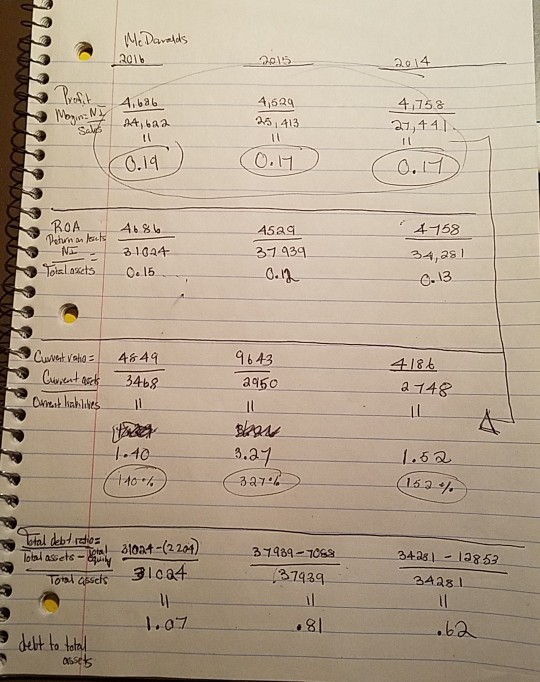
Below is financial information for a McDonalds case Analysis. Also some ratios I calculated. Question: From my calculations, will it be true to conclude that McDonald's profit margin from sales over the 3 years is sluggish or poor. lacking an consistency increase, that's not enough to cover increases in debt over the 3yrs ( shown on last calculation for Total debt ratio)? since debt ratio is increasing and profit margin growth is low.


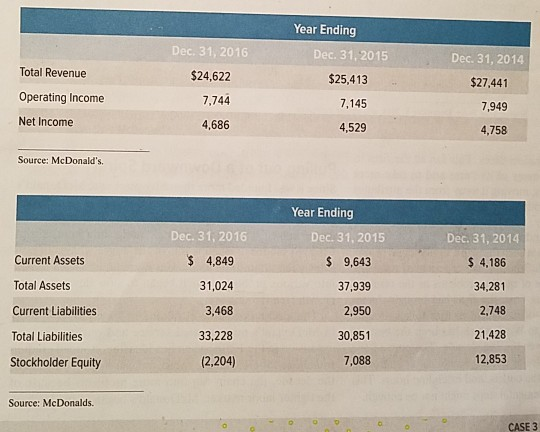
This is all the information given for me to analyze, in the chart in order to do the calculations below. I'm suppose to be do a analysis from this, so my question, is it possible I could make this analysis based on the formulas below?
Year Ending Dec 31, 2015 $25,413 Dec 31, 2016 $24,622 7.744 Total Revenue Dec. 31, 2014 $27.441 Operating Income 7,145 Net Income 4,686 7,949 4,758 4,529 Source: McDonald's, Current Assets Total Assets Dec. 31, 2016 $ 4,849 31,024 3,468 33,228 (2,204) Year Ending Dec 31, 2015 $ 9,643 37,939 2,950 30,851 7,088 Dec 31, 2014 $ 4,186 34,281 2,748 21,428 12,853 Current Liabilities Total Liabilities Stockholder Equity Source: McDonalds. . - - CASE 3 UU Mc Daralds 2016 2015 2014 4,686 4, 622 4,529 25 413 4.758 21,141 0.14 (0.19 O.ID 4-158 ROA 4686 Return an teuts 4529 37939 0.12 31044 0.15 34,981 Tolosets -0.13 Current isto= Current accts Current kable 4649 3468 1 9643 2960 418+ 2748 1.40 (10%) 3.27 327% 1.52 (152% Total debtretlo 21024 -(2204) Total assets - ajwy - 37984 - 7068 (37439 34281 - 13853 34281 Toalcasets 31024 1.07 .81 .62. delt to total assets
Step by Step Solution
There are 3 Steps involved in it
Step: 1

Get Instant Access to Expert-Tailored Solutions
See step-by-step solutions with expert insights and AI powered tools for academic success
Step: 2

Step: 3

Ace Your Homework with AI
Get the answers you need in no time with our AI-driven, step-by-step assistance
Get Started


