Answered step by step
Verified Expert Solution
Link Copied!

Question

1 Approved Answer

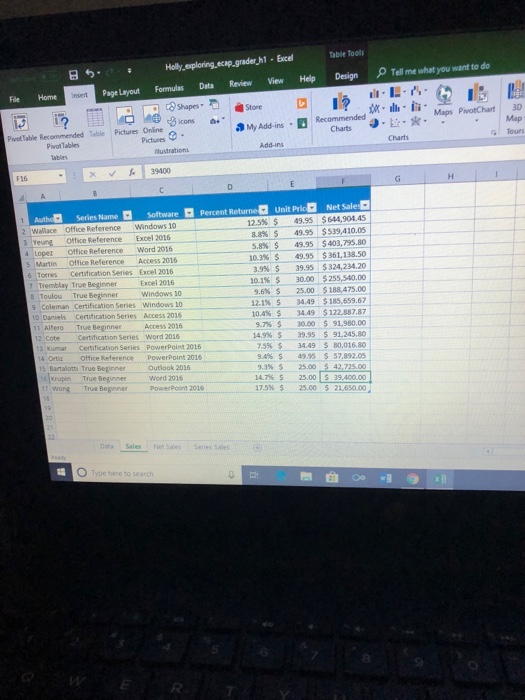
Below is the questions I need help with and my excel spreadsheet (Theres a Data, Sales, Net Sales and Series Sales tab) Click the Sales

Below is the questions I need help with and my excel spreadsheet (Theres a Data, Sales, Net Sales and Series Sales tab)
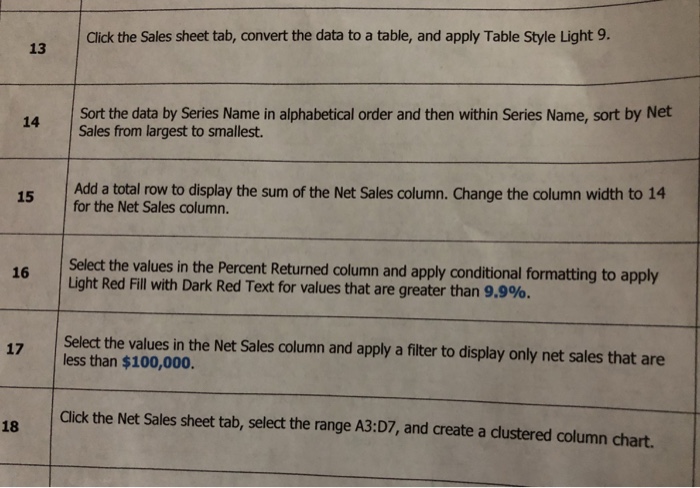
image text in transcribed
Click the Sales sheet tab, convert the data to a table, and apply Table Style Light 9. 13 4 Sort the data by Series Name in alphabetical order and then within Series Name, sort by Net 14 Sales from largest to smallest. 15 Add a total row to display the sum of the Net Sales column. Change the column width to 14 15 for the Net Sales column. Select the Light Red Fill with Dark Red Text for values that are greater than 9.9% values in the Percent Returned column and apply conditional formatting to apply 16 Select the values in the Net Sales column and apply a filter to display only net sales that are less than $100,000. Click the Net Sales sheet tab, select the range A3:D7, and create a clustered column chart

Step by Step Solution

There are 3 Steps involved in it

Step: 1

blur-text-image

Get Instant Access to Expert-Tailored Solutions

See step-by-step solutions with expert insights and AI powered tools for academic success

Step: 2

blur-text-image_2

Step: 3

blur-text-image_3

Ace Your Homework with AI

Get the answers you need in no time with our AI-driven, step-by-step assistance

Get Started

Recommended Textbook for

Pro PowerShell For Database Developers

Authors: Bryan P Cafferky

1st Edition

1484205413, 9781484205419

More Books

Students also viewed these Databases questions