Answered step by step
Verified Expert Solution
Question
1 Approved Answer
Below we give the overall dining experience ratings (Outstanding, Very Good, Good, Average, or Poor) of 30 randomly selected patrons at a restaurant on a
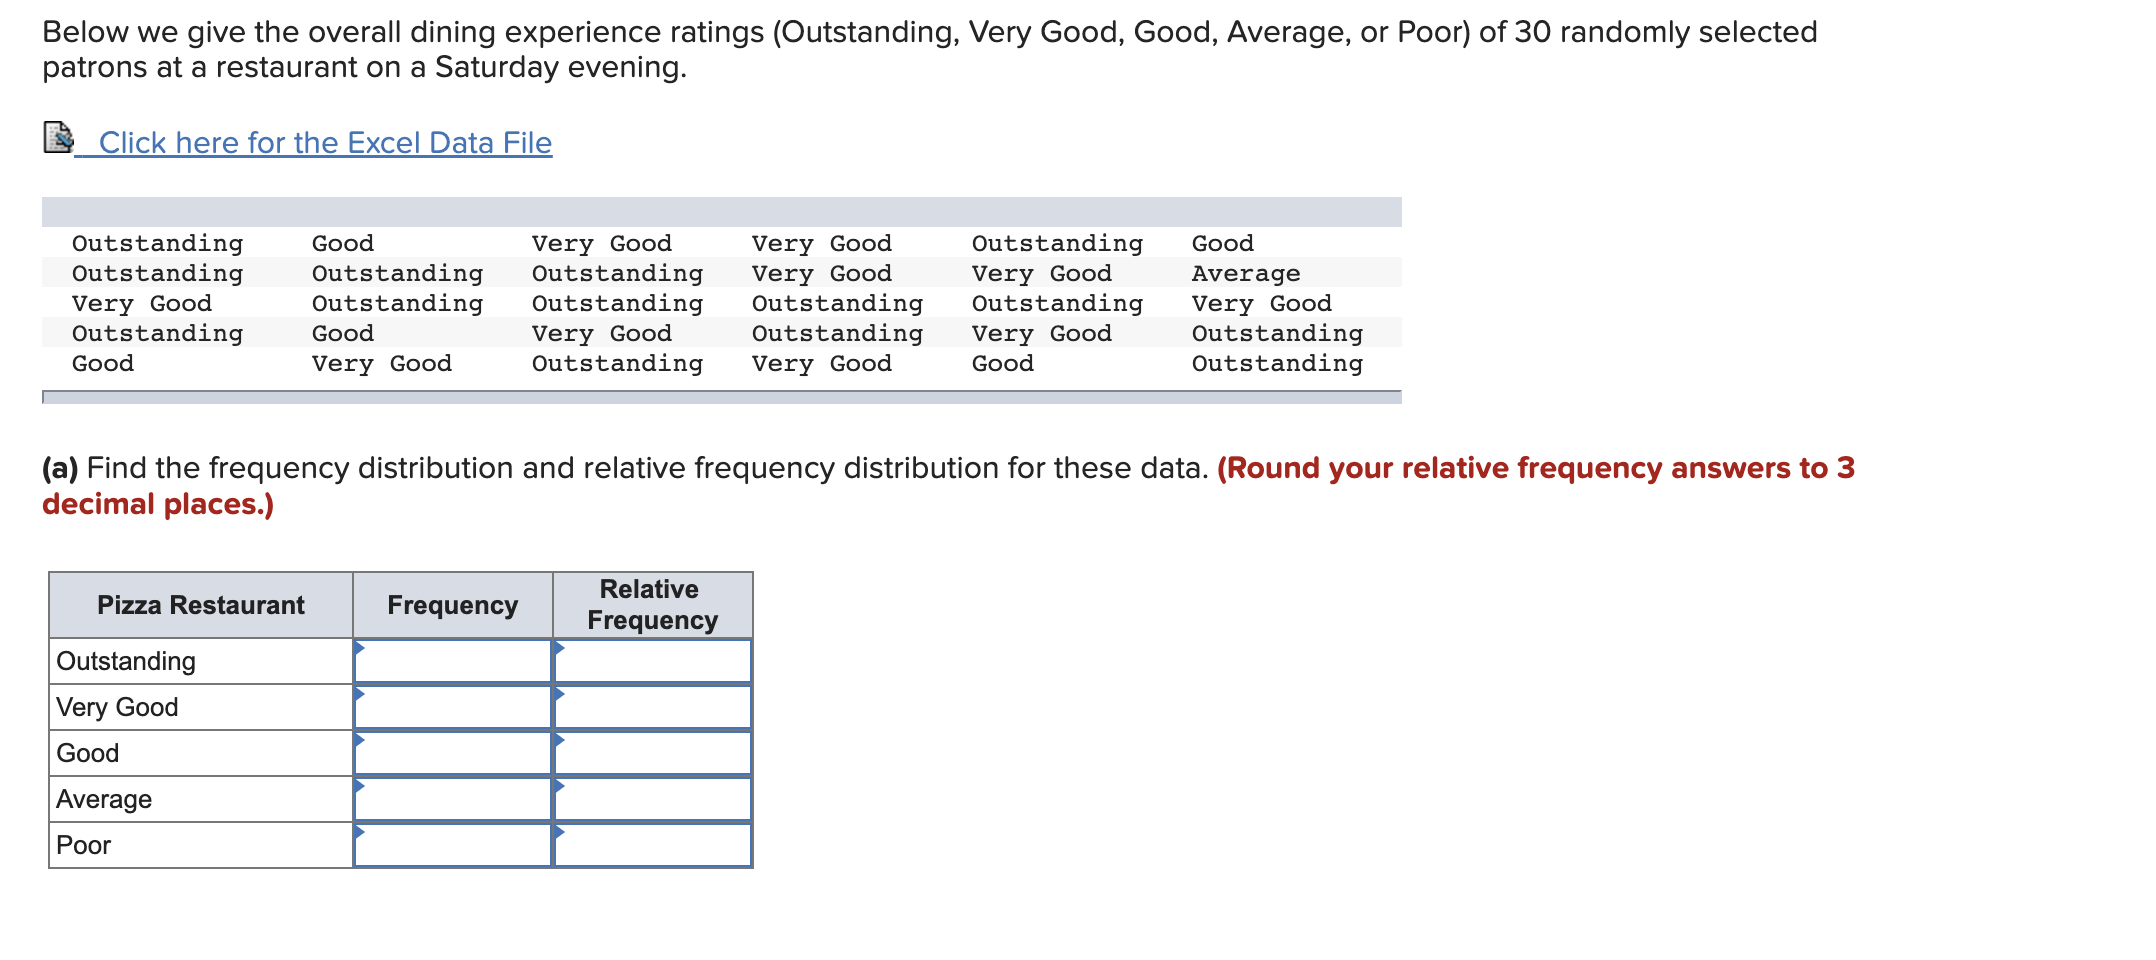
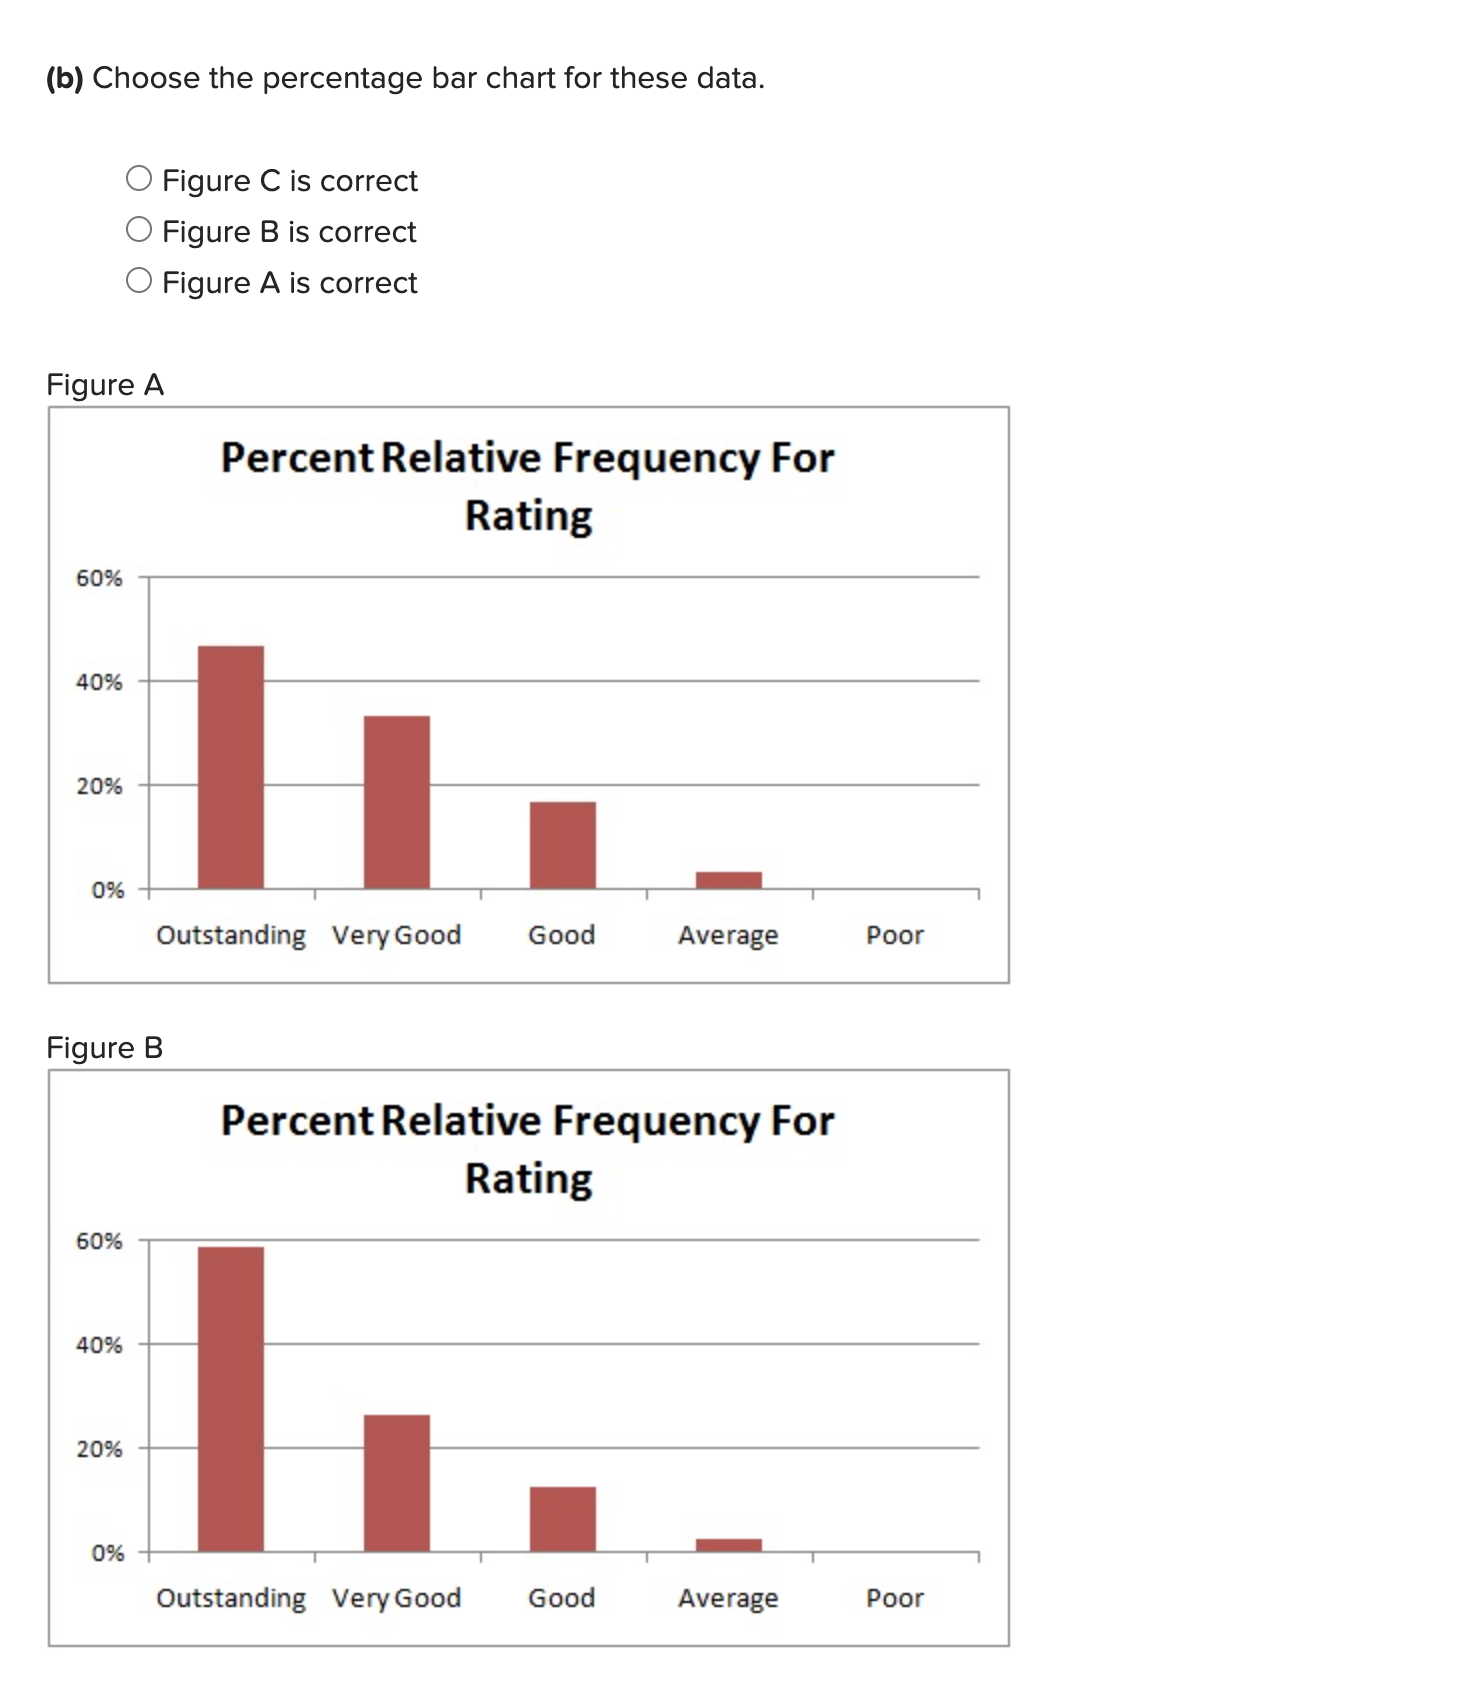
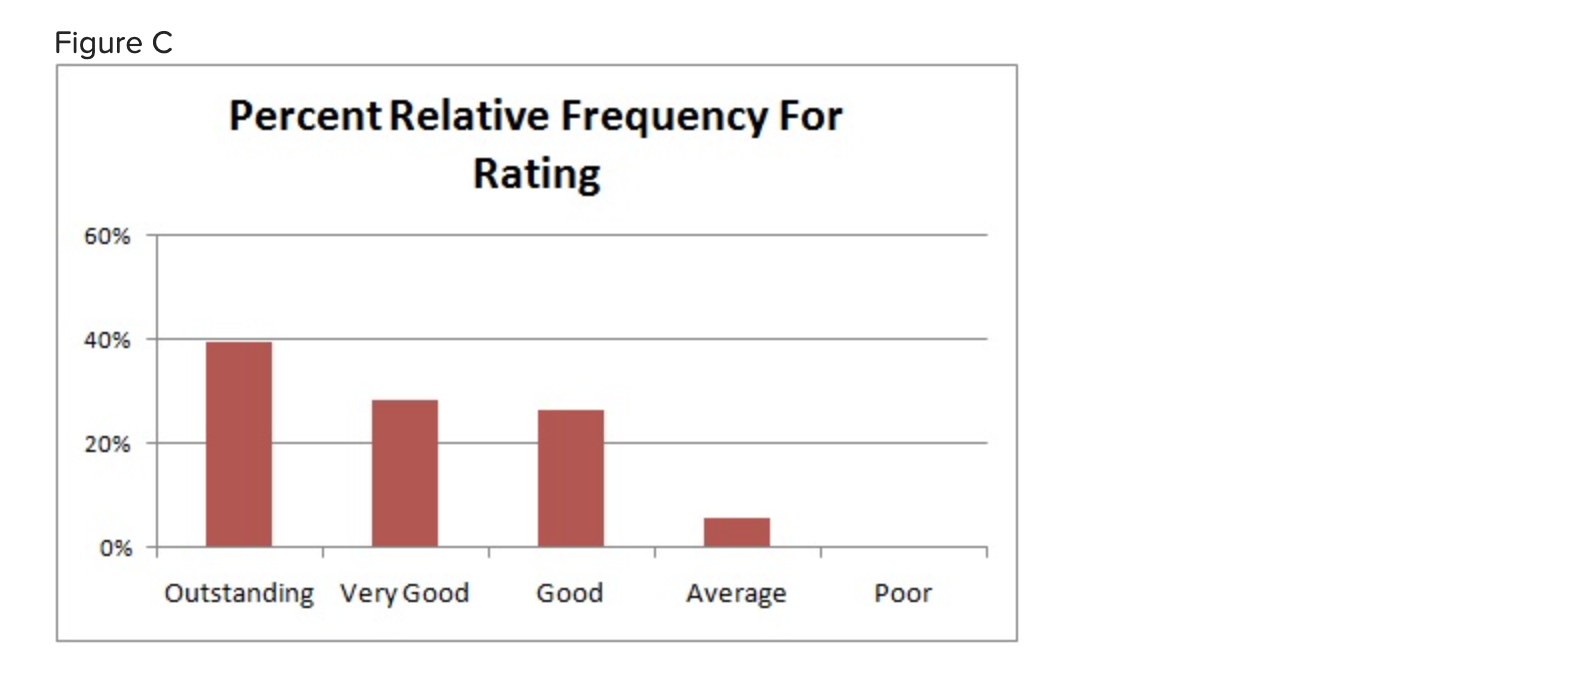
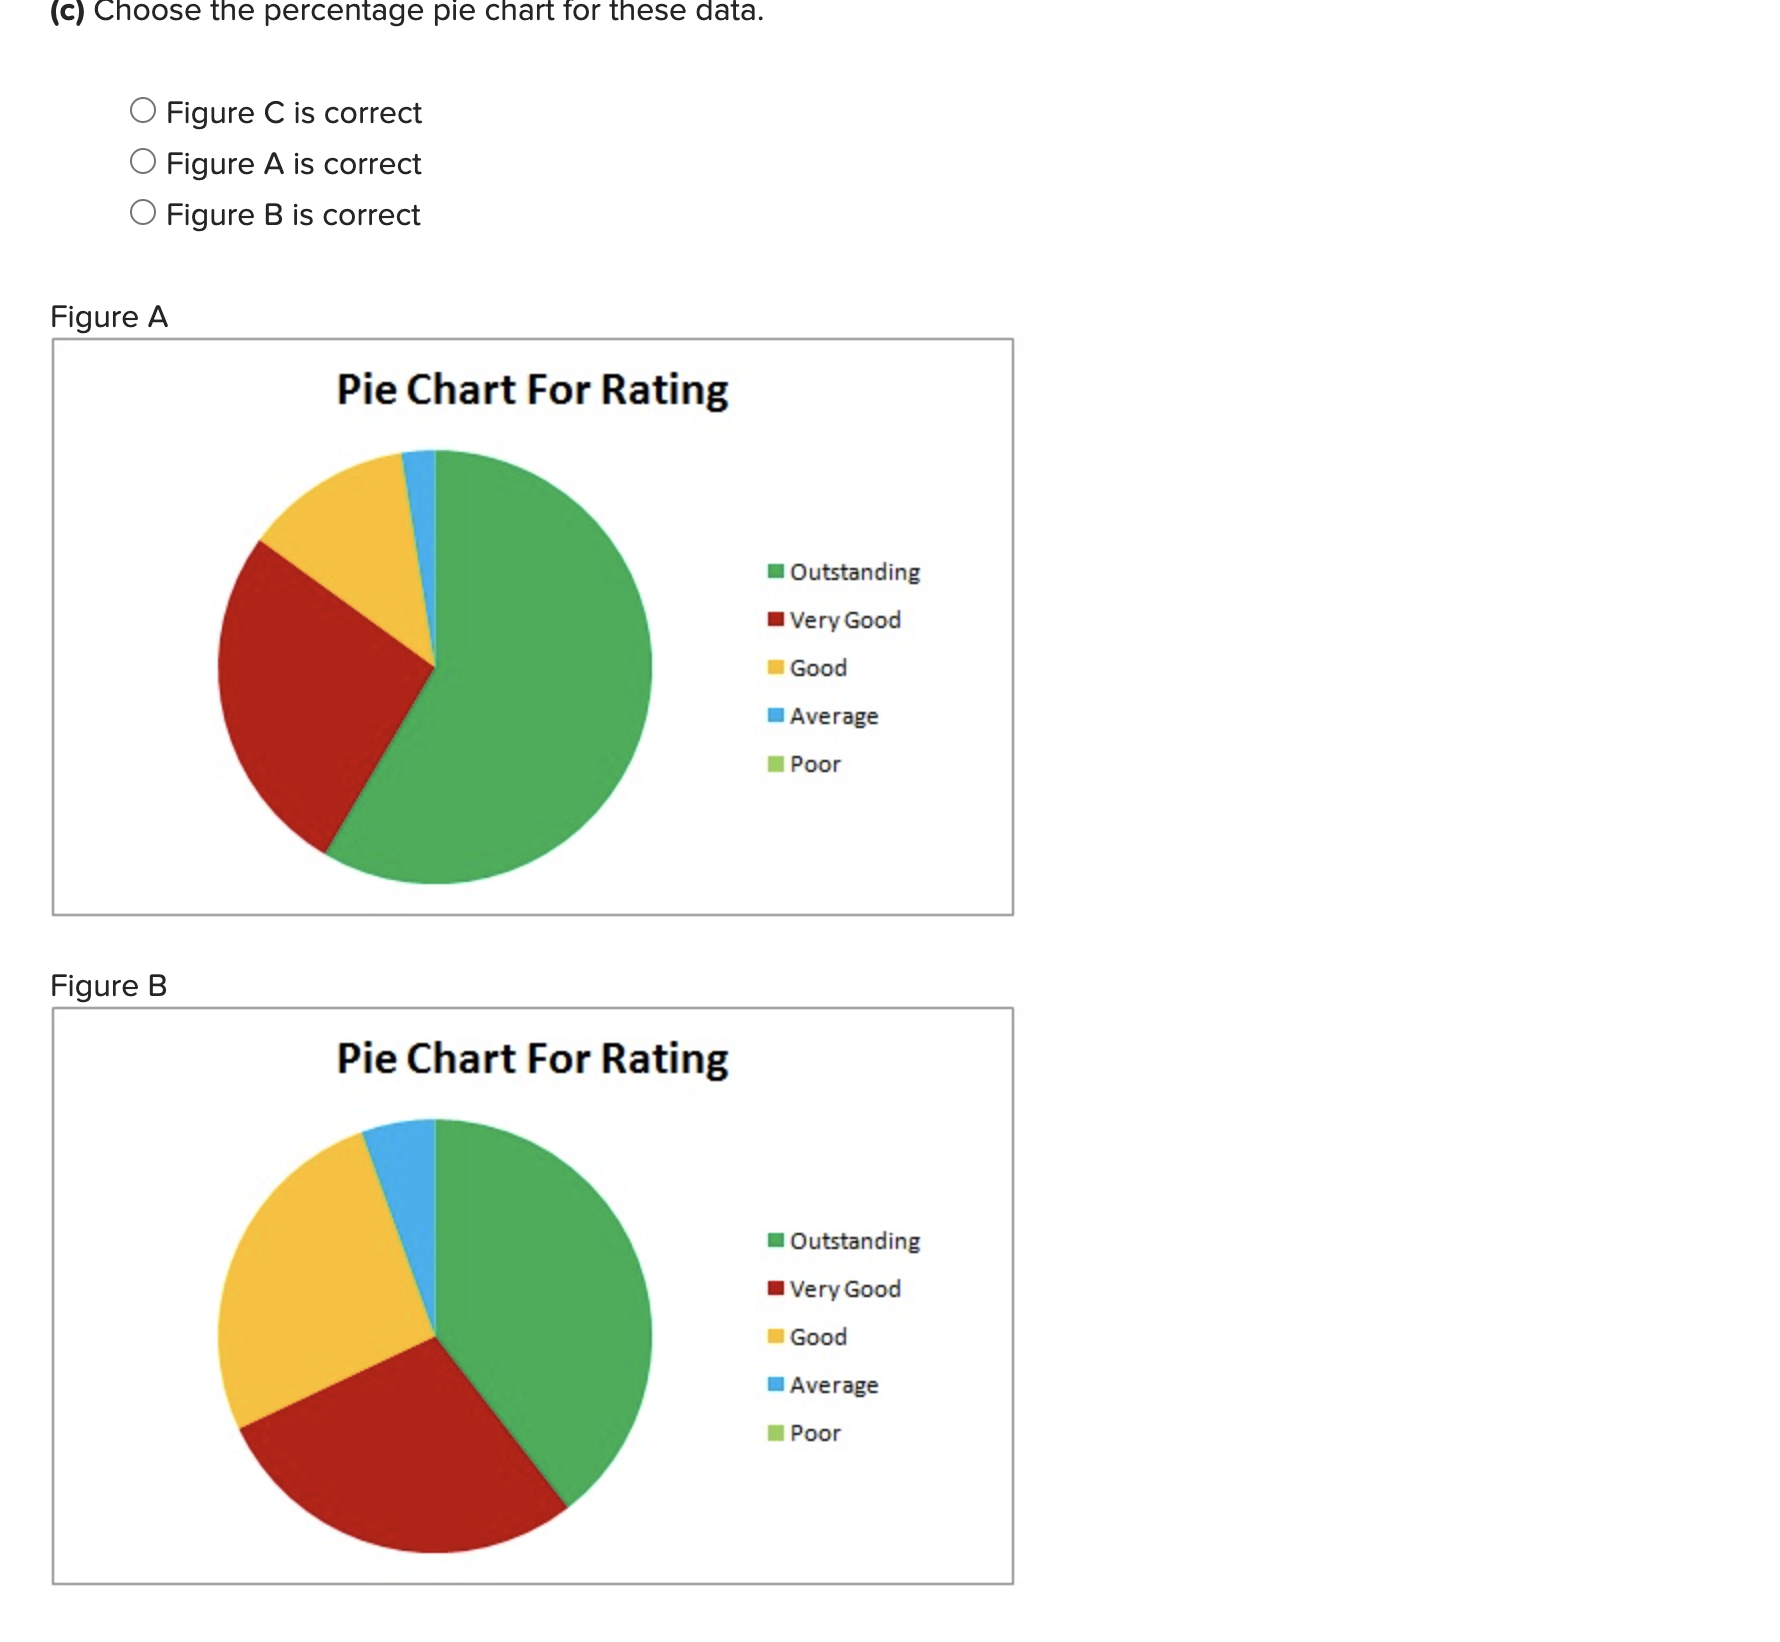
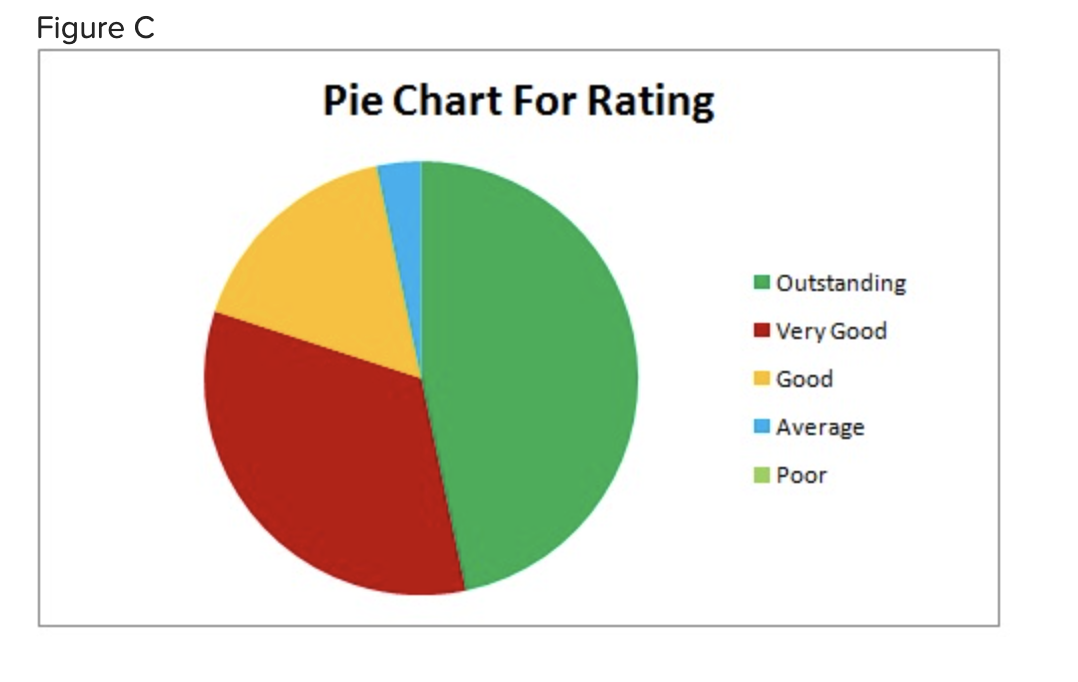 Below we give the overall dining experience ratings (Outstanding, Very Good, Good, Average, or Poor) of 30 randomly selected patrons at a restaurant on a Saturday evening. Click here for the Excel Data File (a) Find the frequency distribution and relative frequency distribution for these data. (Round your relative frequency answers to 3 decimal places.) (b) Choose the percentage bar chart for these data. Figure C is correct Figure B is correct Figure A is correct Fiqure A Finu ure C (c) Choose the percentage pie chart for these data. Figure C is correct Figure A is correct Figure B is correct Figure A Figure C
 Step by Step Solution
There are 3 Steps involved in it
Step: 1

Get Instant Access to Expert-Tailored Solutions
See step-by-step solutions with expert insights and AI powered tools for academic success
Step: 2

Step: 3

Ace Your Homework with AI
Get the answers you need in no time with our AI-driven, step-by-step assistance
Get Started


