Answered step by step
Verified Expert Solution
Question
1 Approved Answer
BER(Bit Error Rate)-SNR(Signal to Noise Raito) curves of a passband communication system will be obtained by simulation as well as analytical calculations. In this


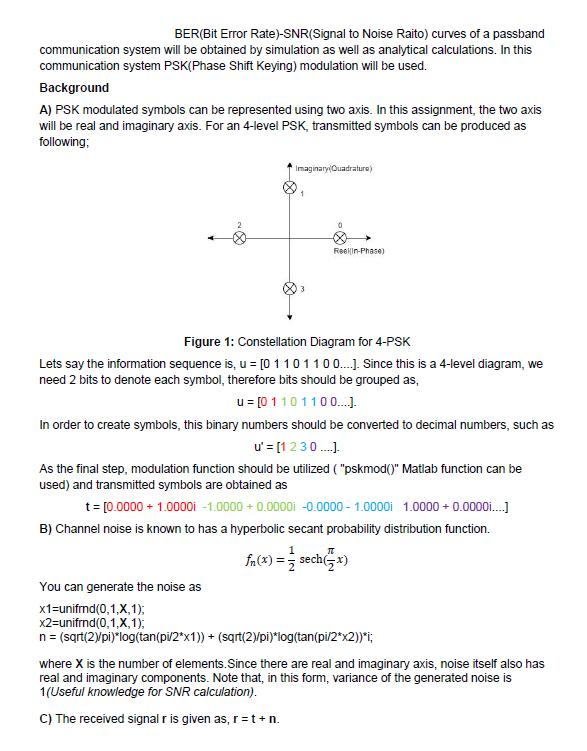
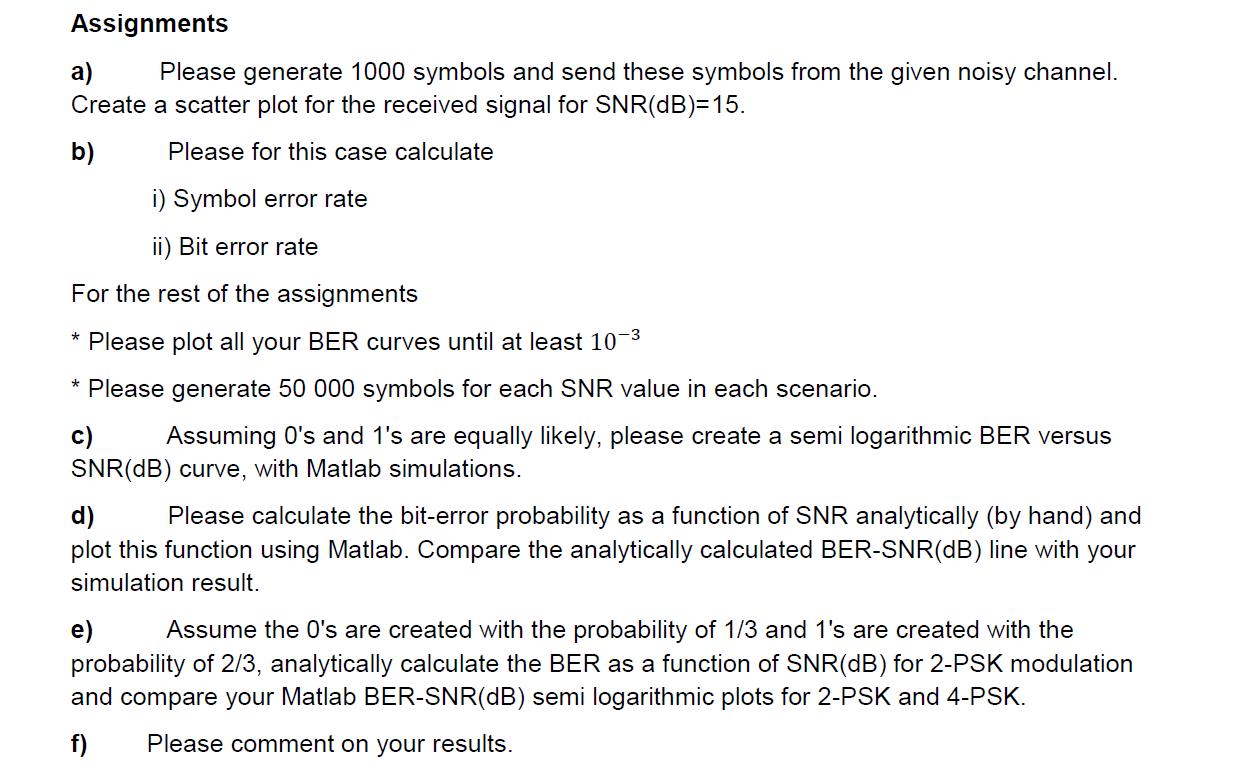
BER(Bit Error Rate)-SNR(Signal to Noise Raito) curves of a passband communication system will be obtained by simulation as well as analytical calculations. In this communication system PSK(Phase Shift Keying) modulation will be used. Background A) PSK modulated symbols can be represented using two axis. In this assignment, the two axis will be real and imaginary axis. For an 4-level PSK, transmitted symbols can be produced as following: Imaginary(Quadrature) 1 You can generate the noise as x1=unifmd(0,1,X,1); x2=unifrnd(0,1,X,1); Reelin-Phase) Figure 1: Constellation Diagram for 4-PSK Lets say the information sequence is, u = [01101100...]. Since this is a 4-level diagram, we need 2 bits to denote each symbol, therefore bits should be grouped as, u= [0110 1100....). In order to create symbols, this binary numbers should be converted to decimal numbers, such as u' = [1 230....]. As the final step, modulation function should be utilized ("pskmod()" Matlab function can be used) and transmitted symbols are obtained as t = [0.0000+ 1.0000i-1.0000+ 0.00001 -0.0000-1.0000i 1.0000+ 0.0000....] B) Channel noise is known to has a hyperbolic secant probability distribution function. 1 fn(x) = sech(x) n = (sqrt(2)/pi)*log(tan(pi/2*x1)) + (sqrt(2)/pi)*log(tan(pi/2*x2))*i; where X is the number of elements. Since there are real and imaginary axis, noise itself also has real and imaginary components. Note that, in this form, variance of the generated noise is 1(Useful knowledge for SNR calculation). C) The received signal r is given as, r=t+n. Assignments a) Please generate 1000 symbols and send these symbols from the given noisy channel. Create a scatter plot for the received signal for SNR(dB)=15. b) Please for this case calculate i) Symbol error rate ii) Bit error rate For the rest of the assignments * Please plot all your BER curves until at least 10- Please generate 50 000 symbols for each SNR value in each scenario. c) Assuming O's and 1's are equally likely, please create a semi logarithmic BER versus SNR(dB) curve, with Matlab simulations. d) Please calculate the bit-error probability as a function of SNR analytically (by hand) and plot this function using Matlab. Compare the analytically calculated BER-SNR(dB) line with your simulation result. e) Assume the O's are created with the probability of 1/3 and 1's are created with the probability of 2/3, analytically calculate the BER as a function of SNR(dB) for 2-PSK modulation and compare your Matlab BER-SNR(dB) semi logarithmic plots for 2-PSK and 4-PSK. f) Please comment on your results.
Step by Step Solution
★★★★★
3.51 Rating (168 Votes )
There are 3 Steps involved in it
Step: 1
a Generate 1000 symbols and send these symbols from the given noisy cha...
Get Instant Access to Expert-Tailored Solutions
See step-by-step solutions with expert insights and AI powered tools for academic success
Step: 2

Step: 3

Ace Your Homework with AI
Get the answers you need in no time with our AI-driven, step-by-step assistance
Get Started


