

Big10Sweaters.com is a new company started last year by two recent college graduates. The idea behind...
Fantastic news! We've Found the answer you've been seeking!
Question:
Transcribed Image Text:
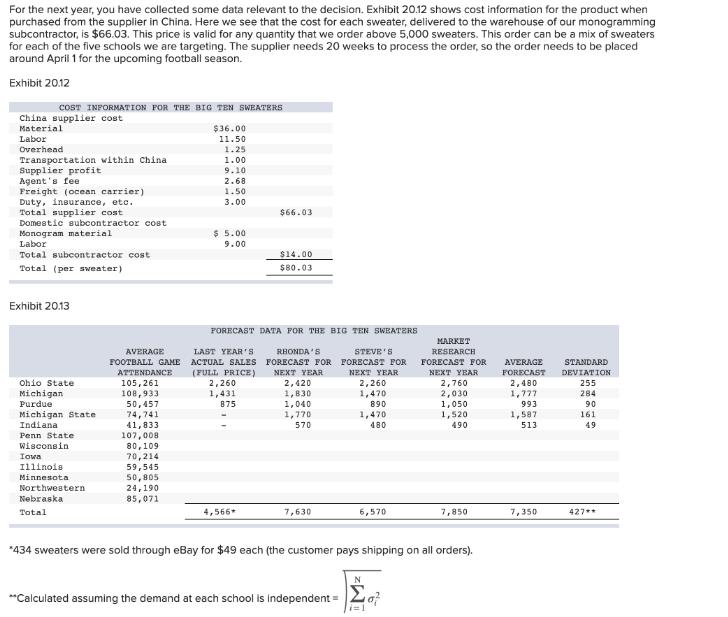
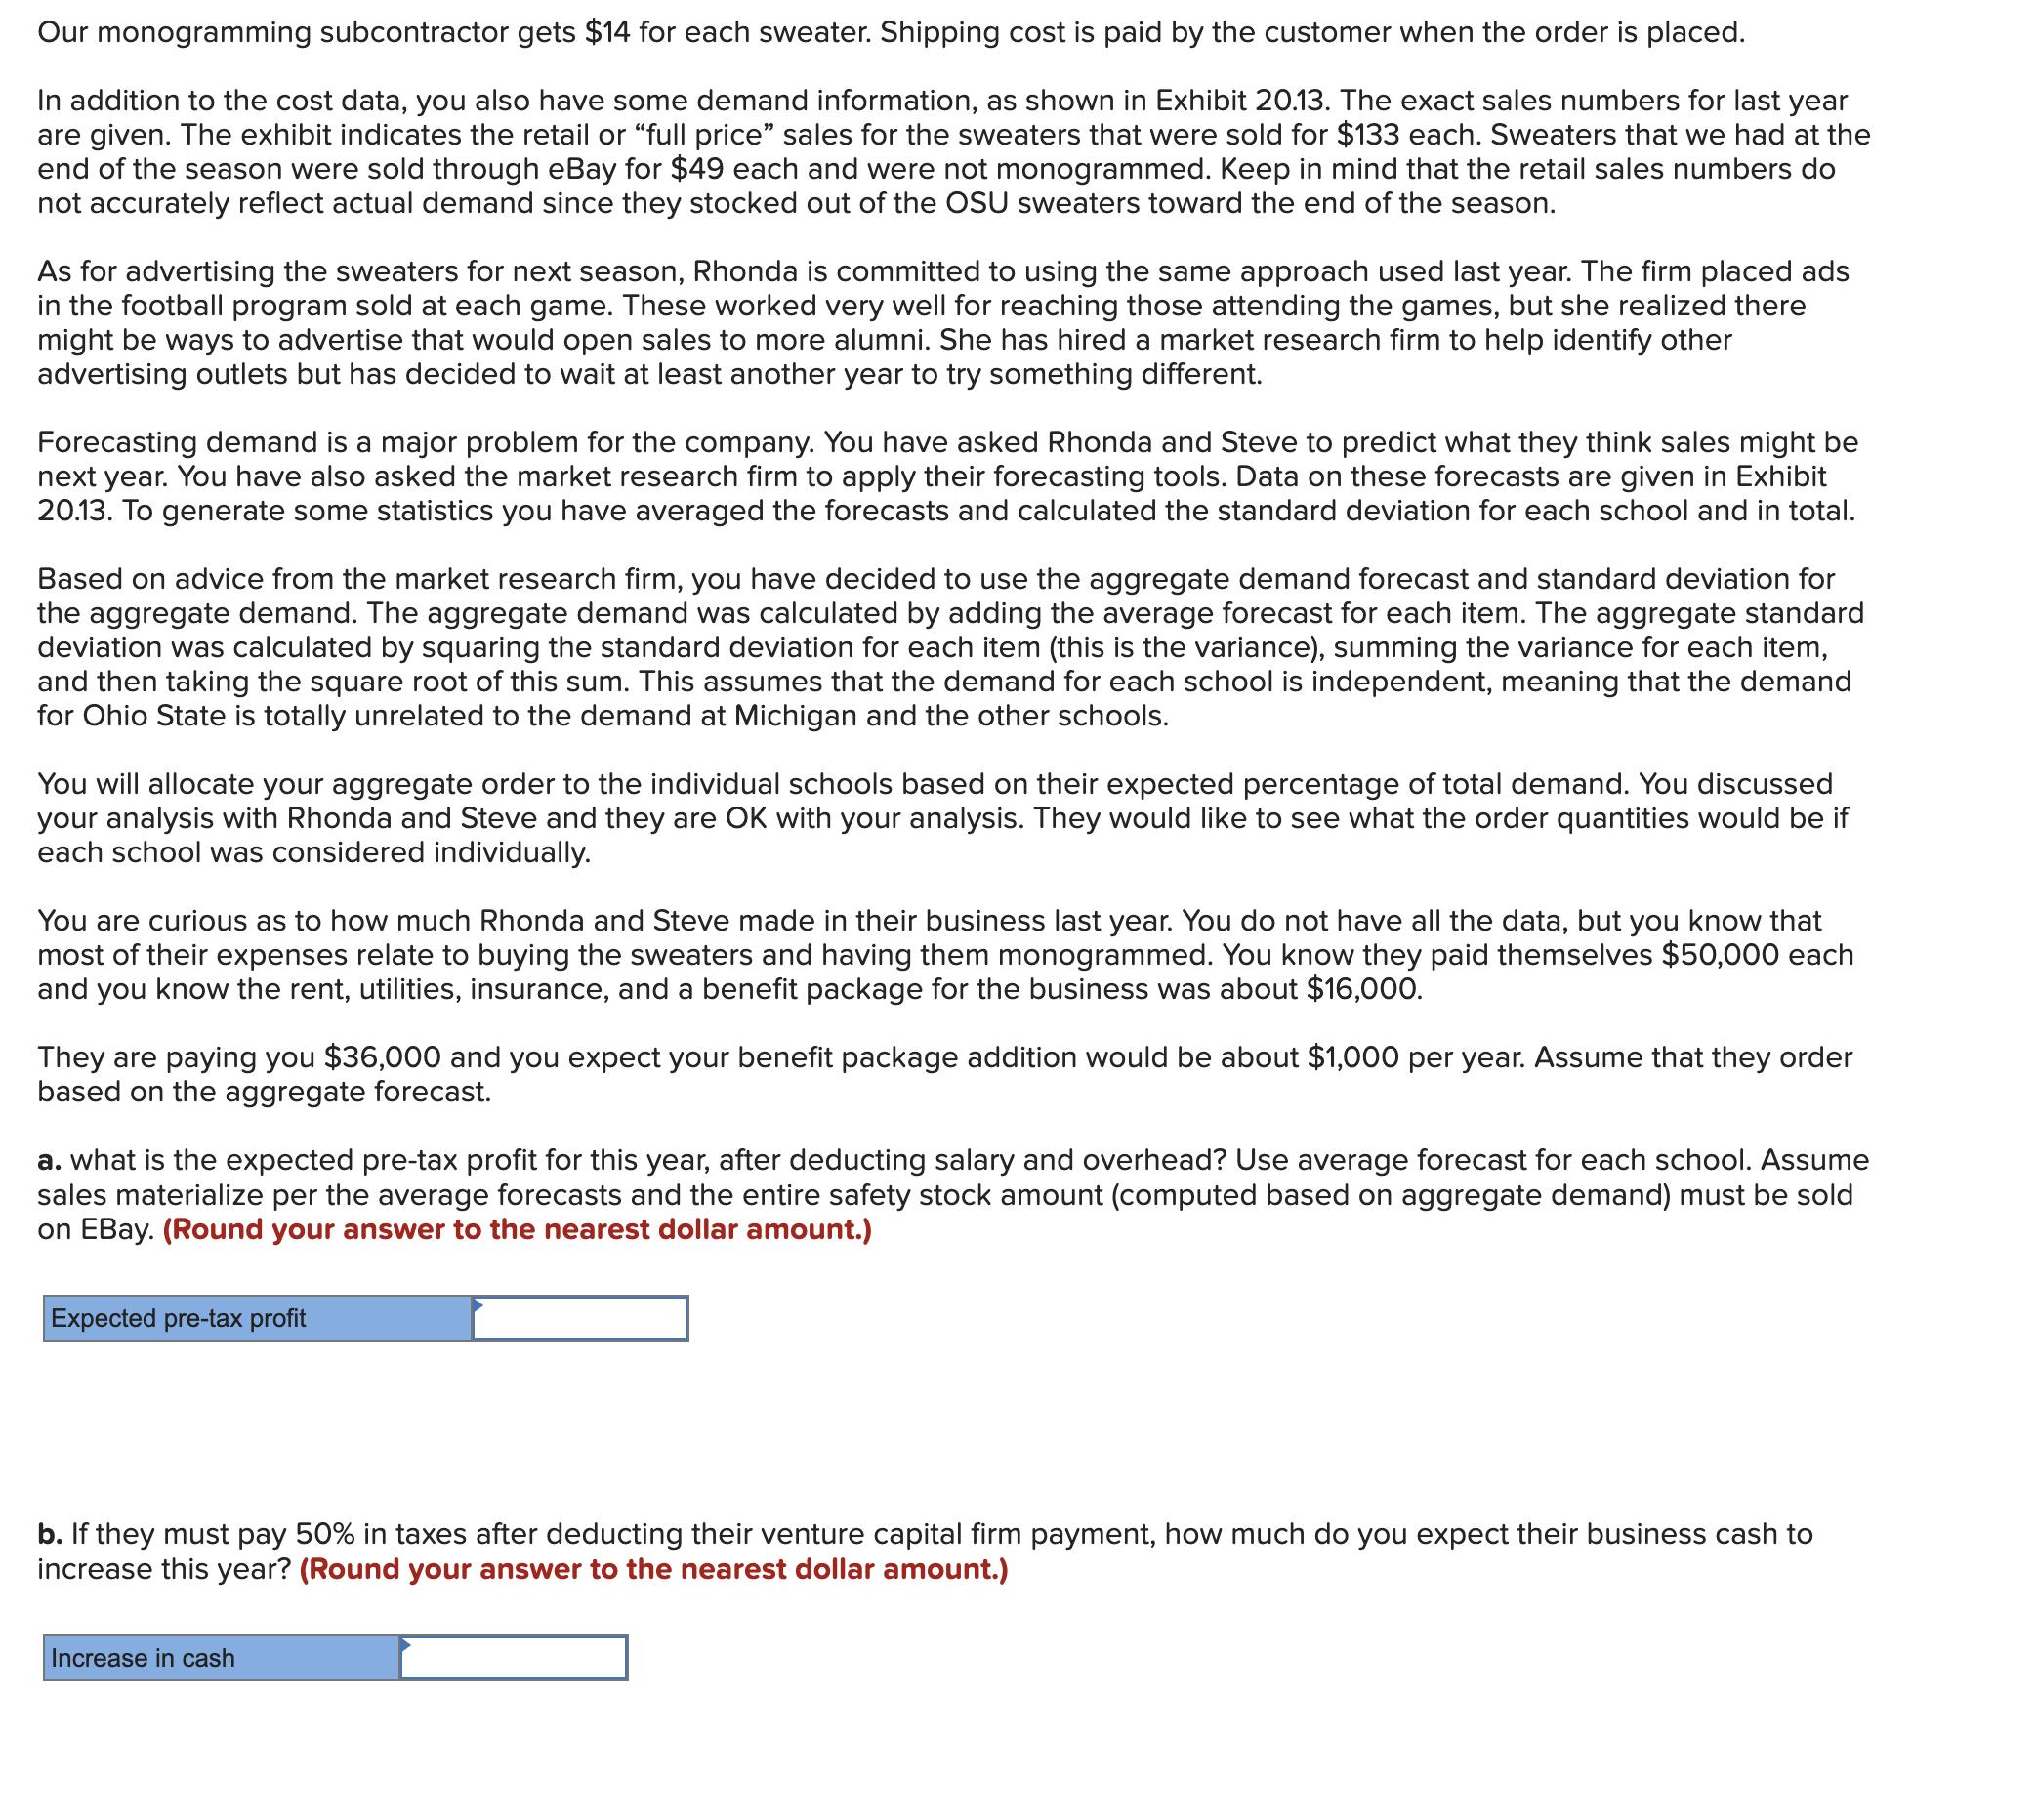
Big10Sweaters.com is a new company started last year by two recent college graduates. The idea behind the company was simple. They will sell premium logo sweaters for Big Ten colleges with one major, unique feature. This unique feature is a special large monogram that has the customer's name, major, and year of graduation. The sweater is the perfect gift for graduating students and alumni, particularly avid football fans who want to show support during the football season. The company is off to a great start and had a successful first year while selling to only a few schools. This year they plan to expand to a few more schools and target the entire Big Ten Conference within three years. You have been hired by Big10Sweaters.com and need to make a good impression by making good supply chain decisions. This is your big opportunity with a startup. There are only two people in the firm and you were hired with the prospect of possibly becoming a principal in the future. You majored in supply chain (operations) management in school and had a great internship at a big retailer that was getting into Internet sales. The experience was great, but now you are on your own and have none of the great support that the big company had. You need to find and analyze your own data and make some big decisions. Of course, Rhonda and Steve, the partners who started the company, are knowledgeable about this venture and they are going to help along the way. Rhonda had the idea to start the company two years ago and talked her friend from business school, Steve, into joining her. Rhonda is into web marketing, has a degree in computer science, and has been working on completing an online MBA. She is as much an artist as a techie. She can really make the website sing. Steve majored in accounting and likes to pump the numbers. He has done a great job of keeping the books and selling the company to some small venture capital people in the area. Last year, he was successful in getting them to invest $2,000,000 in the company (a onetime investment). There were some significant strings attached to this investment in that it stipulated that only $100,000 per year could go toward paying the salary of the two principals. The rest had to be spent on the website, advertising, and inventory. In addition, the venture capital company gets 26 percent of the company profits, before taxes, during the first four years of operation, assuming the company makes a profit. Your first job is to focus on the firm's inventory. The company is centered on selling the premium sweaters to college football fans through a website. Your analysis is important since a significant portion of the company's assets is the inventory that it carries. The business is cyclic, and sales are concentrated during the period leading up to the college football season, which runs between late August and the end of each year. For the upcoming season, the firm wants to sell sweaters to only a few of the largest schools in the Midwest region of the United States. In particular, they are targeting The Ohio State University (OSU), the University of Michigan (UM), Michigan State University (MSU), Purdue University (PU), and Indiana University (IU). These five schools have major football programs and a loyal fan base. The firm has considered the idea of making the sweaters in their own factory, but for now they purchase them from a supplier in China. The prices are great, but service is a problem since the supplier has a 20-week lead time for each order and the minimum order size is 5.000 sweaters. The order can consist of a mix of the different logos, such as 2,000 for OSU, 1.500 for UM, 750 for MSU, 500 for PU. and 250 for IU. Within each logo sub lot, sizes are allocated based on percentages and the supplier suggests 20 percent X-large, 50 percent large, 20 percent medium, and 10 percent small based on their historical data. Once an order is received, a local subcontractor applies the monograms and ships the sweaters to the customer. They store the inventory of sweaters for the company in a small warehouse area located at the subcontractor. This is the company's second year of operation. Last year they only sold sweaters for three of the schools, OSU, UM, and PU. They ordered the minimum 5,000 sweaters and sold all of them, but the experience was painful since they had too many UM sweaters and not enough for OSU fans. Last year they ordered 2,260 OSU, 1,840 UM, and 900 PU sweaters. Of the 5,000 sweaters, 434 had to be sold at a steep discount on eBay after the season. They were hoping not to do this again. For the next year, you have collected some data relevant to the decision. Exhibit 20.12 shows cost information for the product when purchased from the supplier in China. Here we see that the cost for each sweater, delivered to the warehouse of our monogramming subcontractor, is $66.03. This price is valid for any quantity that we order above 5,000 sweaters. This order can be a mix of sweaters for each of the five schools we are targeting. The supplier needs 20 weeks to process the order, so the order needs to be placed around April 1 for the upcoming football season. Exhibit 20.12 COST INFORMATION FOR THE BIG TEN SWEATERS China supplier cost Material Labor Overhead Transportation within China Supplier profit Agent's fee Freight (ocean carrier) Duty, insurance, etc. Total supplier cost Domestic subcontractor cost Monogram material Labor Total subcontractor cost Total (per sweater) Exhibit 20.13 Ohio State Michigan Purdue Michigan State Indiana Penn State Wisconsin Iowa Illinois Minnesota Northwestern Nebraska Total AVERAGE FOOTBALL GAME ATTENDANCE 105,261 108,933 50,457 74,741 41,833 107,008 80,109 70,214 59,545 50,805 24,190 85,071 $36.00 11.50 1.25 1.00 9.10 2.68 1.50 3.00 $5.00 9.00 LAST YEAR'S ACTUAL SALES (FULL PRICE) 2,260 1,431 875 $66.03 FORECAST DATA FOR THE BIG TEN SWEATERS 4,566 $14.00 $80.03 RHONDA'S FORECAST FOR NEXT YEAR 2,420 1,830 1,040 1,770 570 7,630 STEVE'S FORECAST FOR NEXT YEAR 2,260 1,470 890 **Calculated assuming the demand at each school is independent = 1,470 480 6,570 10² MARKET RESEARCH i=1 FORECAST FOR NEXT YEAR *434 sweaters were sold through eBay for $49 each (the customer pays shipping on all orders). 2,760 2,030 1,050 1,520 490 7,850 AVERAGE FORECAST 2,480 1,777 993 1,587 513 7,350 STANDARD DEVIATION 255 284 90 161 49 427** Our monogramming subcontractor gets $14 for each sweater. Shipping cost is paid by the customer when the order is placed. In addition to the cost data, you also have some demand information, as shown in Exhibit 20.13. The exact sales numbers for last year are given. The exhibit indicates the retail or "full price" sales for the sweaters that were sold for $133 each. Sweaters that we had at the end of the season were sold through eBay for $49 each and were not monogrammed. Keep in mind that the retail sales numbers do not accurately reflect actual demand since they stocked out of the OSU sweaters toward the end of the season. As for advertising the sweaters for next season, Rhonda is committed to using the same approach used last year. The firm placed ads in the football program sold at each game. These worked very well for reaching those attending the games, but she realized there might be ways to advertise that would open sales to more alumni. She has hired a market research firm to help identify other advertising outlets but has decided to wait at least another year to try something different. Forecasting demand is a major problem for the company. You have asked Rhonda and Steve to predict what they think sales might be next year. You have also asked the market research firm to apply their forecasting tools. Data on these forecasts are given in Exhibit 20.13. To generate some statistics you have averaged the forecasts and calculated the standard deviation for each school and in total. Based on advice from the market research firm, you have decided to use the aggregate demand forecast and standard deviation for the aggregate demand. The aggregate demand was calculated by adding the average forecast for each item. The aggregate standard deviation was calculated by squaring the standard deviation for each item (this is the variance), summing the variance for each item, and then taking the square root of this sum. This assumes that the demand for each school is independent, meaning that the demand for Ohio State is totally unrelated to the demand at Michigan and the other schools. You will allocate your aggregate order to the individual schools based on their expected percentage of total demand. You discussed your analysis with Rhonda and Steve and they are OK with your analysis. They would like to see what the order quantities would be if each school was considered individually. You are curious as to how much Rhonda and Steve made in their business last year. You do not have all the data, but you know that most of their expenses relate to buying the sweaters and having them monogrammed. You know they paid themselves $50,000 each and you know the rent, utilities, insurance, and a benefit package for the business was about $16,000. They are paying you $36,000 and you expect your benefit package addition would be about $1,000 per year. Assume that they order based on the aggregate forecast. a. what is the expected pre-tax profit for this year, after deducting salary and overhead? Use average forecast for each school. Assume sales materialize per the average forecasts and the entire safety stock amount (computed based on aggregate demand) must be sold on EBay. (Round your answer to the nearest dollar amount.) Expected pre-tax profit b. If they must pay 50% in taxes after deducting their venture capital firm payment, how much do you expect their business cash to increase this year? (Round your answer to the nearest dollar amount.) Increase in cash Big10Sweaters.com is a new company started last year by two recent college graduates. The idea behind the company was simple. They will sell premium logo sweaters for Big Ten colleges with one major, unique feature. This unique feature is a special large monogram that has the customer's name, major, and year of graduation. The sweater is the perfect gift for graduating students and alumni, particularly avid football fans who want to show support during the football season. The company is off to a great start and had a successful first year while selling to only a few schools. This year they plan to expand to a few more schools and target the entire Big Ten Conference within three years. You have been hired by Big10Sweaters.com and need to make a good impression by making good supply chain decisions. This is your big opportunity with a startup. There are only two people in the firm and you were hired with the prospect of possibly becoming a principal in the future. You majored in supply chain (operations) management in school and had a great internship at a big retailer that was getting into Internet sales. The experience was great, but now you are on your own and have none of the great support that the big company had. You need to find and analyze your own data and make some big decisions. Of course, Rhonda and Steve, the partners who started the company, are knowledgeable about this venture and they are going to help along the way. Rhonda had the idea to start the company two years ago and talked her friend from business school, Steve, into joining her. Rhonda is into web marketing, has a degree in computer science, and has been working on completing an online MBA. She is as much an artist as a techie. She can really make the website sing. Steve majored in accounting and likes to pump the numbers. He has done a great job of keeping the books and selling the company to some small venture capital people in the area. Last year, he was successful in getting them to invest $2,000,000 in the company (a onetime investment). There were some significant strings attached to this investment in that it stipulated that only $100,000 per year could go toward paying the salary of the two principals. The rest had to be spent on the website, advertising, and inventory. In addition, the venture capital company gets 26 percent of the company profits, before taxes, during the first four years of operation, assuming the company makes a profit. Your first job is to focus on the firm's inventory. The company is centered on selling the premium sweaters to college football fans through a website. Your analysis is important since a significant portion of the company's assets is the inventory that it carries. The business is cyclic, and sales are concentrated during the period leading up to the college football season, which runs between late August and the end of each year. For the upcoming season, the firm wants to sell sweaters to only a few of the largest schools in the Midwest region of the United States. In particular, they are targeting The Ohio State University (OSU), the University of Michigan (UM), Michigan State University (MSU), Purdue University (PU), and Indiana University (IU). These five schools have major football programs and a loyal fan base. The firm has considered the idea of making the sweaters in their own factory, but for now they purchase them from a supplier in China. The prices are great, but service is a problem since the supplier has a 20-week lead time for each order and the minimum order size is 5.000 sweaters. The order can consist of a mix of the different logos, such as 2,000 for OSU, 1.500 for UM, 750 for MSU, 500 for PU. and 250 for IU. Within each logo sub lot, sizes are allocated based on percentages and the supplier suggests 20 percent X-large, 50 percent large, 20 percent medium, and 10 percent small based on their historical data. Once an order is received, a local subcontractor applies the monograms and ships the sweaters to the customer. They store the inventory of sweaters for the company in a small warehouse area located at the subcontractor. This is the company's second year of operation. Last year they only sold sweaters for three of the schools, OSU, UM, and PU. They ordered the minimum 5,000 sweaters and sold all of them, but the experience was painful since they had too many UM sweaters and not enough for OSU fans. Last year they ordered 2,260 OSU, 1,840 UM, and 900 PU sweaters. Of the 5,000 sweaters, 434 had to be sold at a steep discount on eBay after the season. They were hoping not to do this again. For the next year, you have collected some data relevant to the decision. Exhibit 20.12 shows cost information for the product when purchased from the supplier in China. Here we see that the cost for each sweater, delivered to the warehouse of our monogramming subcontractor, is $66.03. This price is valid for any quantity that we order above 5,000 sweaters. This order can be a mix of sweaters for each of the five schools we are targeting. The supplier needs 20 weeks to process the order, so the order needs to be placed around April 1 for the upcoming football season. Exhibit 20.12 COST INFORMATION FOR THE BIG TEN SWEATERS China supplier cost Material Labor Overhead Transportation within China Supplier profit Agent's fee Freight (ocean carrier) Duty, insurance, etc. Total supplier cost Domestic subcontractor cost Monogram material Labor Total subcontractor cost Total (per sweater) Exhibit 20.13 Ohio State Michigan Purdue Michigan State Indiana Penn State Wisconsin Iowa Illinois Minnesota Northwestern Nebraska Total AVERAGE FOOTBALL GAME ATTENDANCE 105,261 108,933 50,457 74,741 41,833 107,008 80,109 70,214 59,545 50,805 24,190 85,071 $36.00 11.50 1.25 1.00 9.10 2.68 1.50 3.00 $5.00 9.00 LAST YEAR'S ACTUAL SALES (FULL PRICE) 2,260 1,431 875 $66.03 FORECAST DATA FOR THE BIG TEN SWEATERS 4,566 $14.00 $80.03 RHONDA'S FORECAST FOR NEXT YEAR 2,420 1,830 1,040 1,770 570 7,630 STEVE'S FORECAST FOR NEXT YEAR 2,260 1,470 890 **Calculated assuming the demand at each school is independent = 1,470 480 6,570 10² MARKET RESEARCH i=1 FORECAST FOR NEXT YEAR *434 sweaters were sold through eBay for $49 each (the customer pays shipping on all orders). 2,760 2,030 1,050 1,520 490 7,850 AVERAGE FORECAST 2,480 1,777 993 1,587 513 7,350 STANDARD DEVIATION 255 284 90 161 49 427** Our monogramming subcontractor gets $14 for each sweater. Shipping cost is paid by the customer when the order is placed. In addition to the cost data, you also have some demand information, as shown in Exhibit 20.13. The exact sales numbers for last year are given. The exhibit indicates the retail or "full price" sales for the sweaters that were sold for $133 each. Sweaters that we had at the end of the season were sold through eBay for $49 each and were not monogrammed. Keep in mind that the retail sales numbers do not accurately reflect actual demand since they stocked out of the OSU sweaters toward the end of the season. As for advertising the sweaters for next season, Rhonda is committed to using the same approach used last year. The firm placed ads in the football program sold at each game. These worked very well for reaching those attending the games, but she realized there might be ways to advertise that would open sales to more alumni. She has hired a market research firm to help identify other advertising outlets but has decided to wait at least another year to try something different. Forecasting demand is a major problem for the company. You have asked Rhonda and Steve to predict what they think sales might be next year. You have also asked the market research firm to apply their forecasting tools. Data on these forecasts are given in Exhibit 20.13. To generate some statistics you have averaged the forecasts and calculated the standard deviation for each school and in total. Based on advice from the market research firm, you have decided to use the aggregate demand forecast and standard deviation for the aggregate demand. The aggregate demand was calculated by adding the average forecast for each item. The aggregate standard deviation was calculated by squaring the standard deviation for each item (this is the variance), summing the variance for each item, and then taking the square root of this sum. This assumes that the demand for each school is independent, meaning that the demand for Ohio State is totally unrelated to the demand at Michigan and the other schools. You will allocate your aggregate order to the individual schools based on their expected percentage of total demand. You discussed your analysis with Rhonda and Steve and they are OK with your analysis. They would like to see what the order quantities would be if each school was considered individually. You are curious as to how much Rhonda and Steve made in their business last year. You do not have all the data, but you know that most of their expenses relate to buying the sweaters and having them monogrammed. You know they paid themselves $50,000 each and you know the rent, utilities, insurance, and a benefit package for the business was about $16,000. They are paying you $36,000 and you expect your benefit package addition would be about $1,000 per year. Assume that they order based on the aggregate forecast. a. what is the expected pre-tax profit for this year, after deducting salary and overhead? Use average forecast for each school. Assume sales materialize per the average forecasts and the entire safety stock amount (computed based on aggregate demand) must be sold on EBay. (Round your answer to the nearest dollar amount.) Expected pre-tax profit b. If they must pay 50% in taxes after deducting their venture capital firm payment, how much do you expect their business cash to increase this year? (Round your answer to the nearest dollar amount.) Increase in cash
Expert Answer:
Answer rating: 100% (QA)
SOLUTION a To calculate the expected pretax profit we need to consider the revenue cost and expenses Revenue Based on the average forecast for each school the total expected revenue can be calculated ... View the full answer

Related Book For 

Posted Date:
Students also viewed these general management questions
-
Sweaters.com is a new company started last year by two recent college graduates. The idea behind the company was simple. They will sell premium logo sweaters for Big Ten colleges with one major,...
-
Density (k) and space mean speed (vs) data have been collected from a traffic survey for a k specific highway and the expression: kf is developed to describe the speed- V = V fe density relationship....
-
Jimmy Ltd has the following items in his balance sheet as at 30 April 2019: Item R 20 900 4 950 1600 3 280 Capital Stock of goods Creditors Debtors Motor Vehicles Fixtures Cash at bank Cash in hand 4...
-
To pick up the execution results, one can use the executeQuery() and executeUpdate() methods. The former returns an integer, and the latter returns a ResultSet.(True/False)
-
What is rent seeking, and how is it related to regulatory capture?
-
Evaluate each expression. (-1)-(-1)-- 2 2
-
Find product solutions, \(u(x, t)=b(t) \phi(x)\), to the heat equation satisfying the boundary conditions \(u_{x}(0, t)=0\) and \(u(L, t)=0\). Use these solutions to find a general solution of the...
-
Tory, Becky, Hal, and Jere form TBHJ Partnership as equal owners. TBJH Partnership rents heavy tools and equipment. Becky and Hal are married to each other while Tory and Jere are brothers but are...
-
Business Transactions: On June 1, the owner invested $15,000 cash in the business. On June 4, he bought supplies for $ 5000, 3000 cash and 2000 on Note payable. On June 5, he bought furniture in cash...
-
The statement of cash flows for Riker Company (prepared using the indirect method) follows. Consider the following additional information: (a) Sales for the year totaled $812,350. Cost of goods sold...
-
You are in charge of the manufacture of cylinders of compressed gas at a small company. Your company president would like to offer a 4.00 L cylinder containing 500 g of chlorine in the new catalog....
-
1 . Make a list of the industry's key success factors and measures of competitive strength or weakness. 2 . Assign weights to each competitive strength measure based on its perceived importance.
-
Suppose you currently have $5,000 in your savings account. You will withdraw $2,000 for a vacation to Costa Rica in two years (t = 2), and you will add $5,000 to your account in five years (t = 5)....
-
Let M be the Turing machine defined by 8 90 91 92 B 91, B, R 91, B. R 91, a, R 92, b, L b 91, b, R 92, a, L 92, C, L a) Trace the computation for the input string abcab. b) Trace the first six...
-
The following data is provided for Garcon Company and Pepper Company for the year ended December 31. Finished goods inventory, beginning Work in process inventory, beginning Raw materials inventory,...
-
The Braxton Machinery Company makes bottle-capping equipment. Each order is somewhat different from all others, so that the firm uses job order costing. There are two departments, Machining and...
-
Example: Capital Rationing Mayco has a $ 2 , 0 0 0 capital budget and has the opportunity to invest in five different projects. The initial investment and NPV of the projects arc described in the...
-
In each of the following independent cases, document the system using whatever technique(s) your instructor specifies. a. Dreambox Creations (www.dreamboxcreations.com/) in Diamond Bar, California,...
-
On July 1, 2012, Norilsk acquired 90% of the capital of Rudny for $290,160. The equity of Rudny at this date consisted of: Share capital............. $200,000 Retained earnings............. 80,000...
-
Chevron Inc. decided on May 1, 2013, to acquire all of the outstanding shares of Chow Ltd. The preliminary acquisition price is to be based on the year-end nancial statements dated March 31, 2013....
-
How is fair value determined?
-
The prices of new electronic gadgets usually come down over time. Write About It Write a paragraph explaining why this might occur. Also explain how those prices might affect your financial planning...
-
Describe the six strategies of financial planning.
-
Explain personal financial planning and its importance.

Study smarter with the SolutionInn App