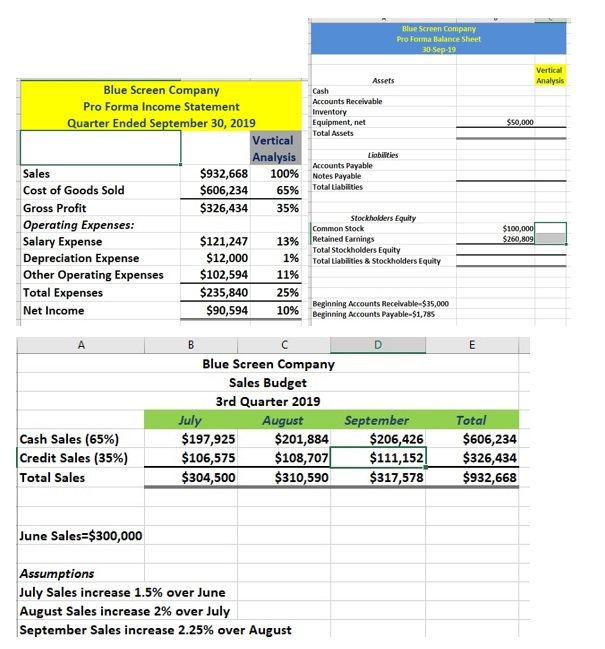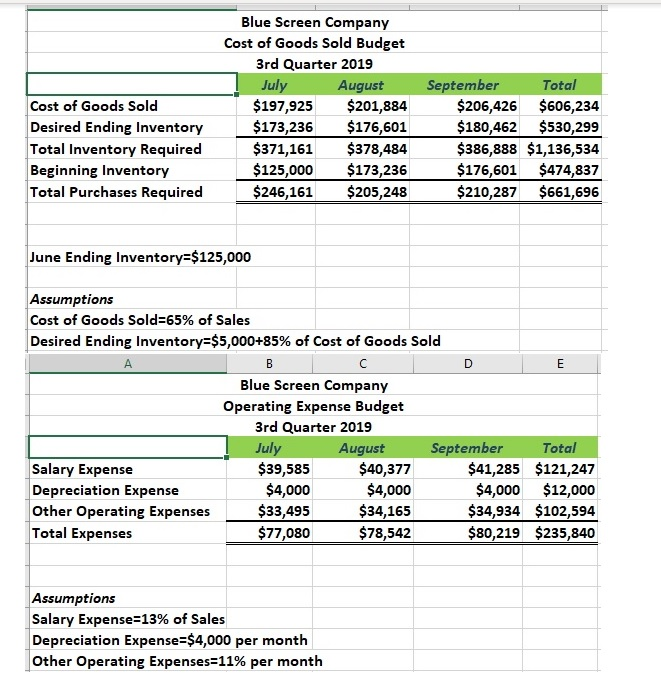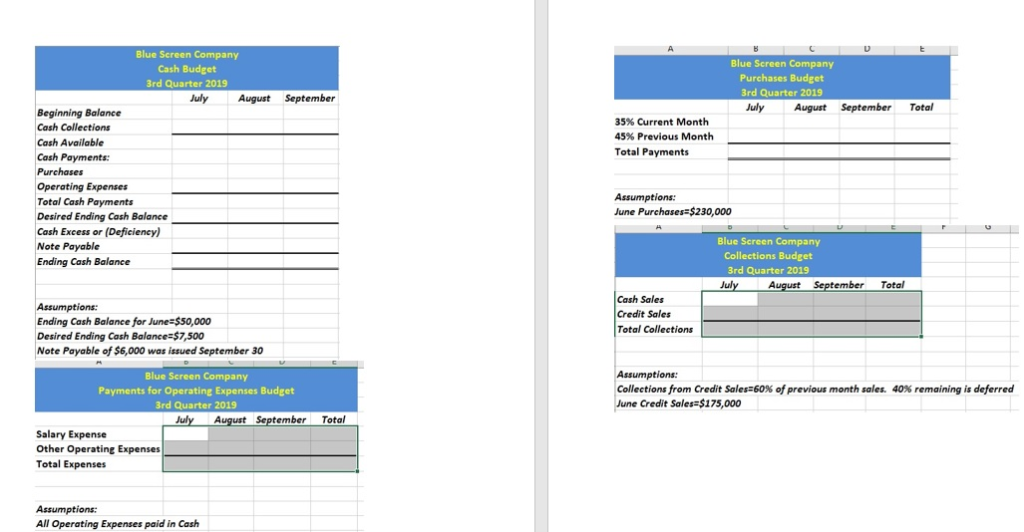


Blue Screen Company Pro Forma Lalance Sheet 30-Sep-19 Vertical Analysis Assets Cash Accounts Receivable Inventory Equipment, net Total Assets $50.000 Liabilties Accounts Payable Notes Payable Total Liabilities Blue Screen Company Pro Forma Income Statement Quarter Ended September 30, 2019 Vertical Analysis Sales $932,668 100% Cost of Goods Sold $606,234 65% Gross Profit $326,434 35% Operating Expenses: Salary Expense $121,247 13% Depreciation Expense $12,000 1% Other Operating Expenses $102,594 11% Total Expenses $235,840 25% Net Income $90,594 10% Stockholders Equity Common Stock Retained Earnings Total Stockholders Equity Total Liabilities & Stockholders Equity $100,000 $260,809 Beginning Accounts Receivable-$35,000 Beginning Accounts Payable-51,785 Blue Screen Company Sales Budget 3rd Quarter 2019 July August $197,925 $ 201,884 $106,575 $108,707 $304,500 $310,590 Cash Sales (65%) Credit Sales (35%) Total Sales September $206,426 $111,1521 $317,578 Total $606,234 $326,434 $932,668 June Sales=$300,000 Assumptions July Sales increase 1.5% over June August Sales increase 2% over July September Sales increase 2.25% over August Cost of Goods Sold Desired Ending Inventory Total Inventory Required Beginning Inventory Total Purchases Required Blue Screen Company Cost of Goods Sold Budget 3rd Quarter 2019 July August $197,925 $201,884 $173,236 $176,601 $371,161 $378,484 $125,000 $173,236 $246,161 $205,248 September Total $206,426 $606,234 $180,462 $530,299 $386,888 $1,136,534 $176,601 $474,837 $210,287 $661,696 June Ending Inventory=$125,000 Assumptions Cost of Goods Sold=65% of Sales Desired Ending Inventory=$5,000+85% of Cost of Goods Sold B C Blue Screen Company Operating Expense Budget 3rd Quarter 2019 July August September Total Salary Expense $39,585 $40,377 $41,285 $121,247 Depreciation Expense $4,000 $4,000 $4,000 $12,000 Other Operating Expenses $33,495 $34,165 $34,934 $102,594 Total Expenses $77,080 $78,542 $80,219 $235,840 Assumptions Salary Expense=13% of Sales Depreciation Expense=$4,000 per month Other Operating Expenses=11% per month Blue Screen Company Purchases Budget 3rd Quarter 2019 July August September September Total 35% Current Month 45% Previous Month Total Payments Blue Screen Company Cash Budget 3rd Quarter 2019 July August Beginning Balance Cash Collections Cash Available Cash Payments: Purchases Operating Expenses Total Cash Payments Desired Ending Cash Balance Cash Excess or (Deficiency) Note Payable Ending Cash Balance Assumptions: June Purchases $230,000 Blue Screen Company Collections Budget 3rd Quarter 2019 July August September Total Assumptions: Ending Cash Balance for June=$50,000 Desired Ending Cash Balance=$7,500 Note Payable of $6,000 was issued September 30 Cash Sales Credit Sales Total Collections Assumptions: Collections from Credit Solen 60x of previous month sales 40 June Credit Sales $175,000 remaining is deferred Blue Screen Company Payments for Operating Expenses Budget 3rd Quarter 2019 July August September Salary Expense Other Operating Expenses Total Expenses Total Assumptions: All Operating Expenses paid in Cash


