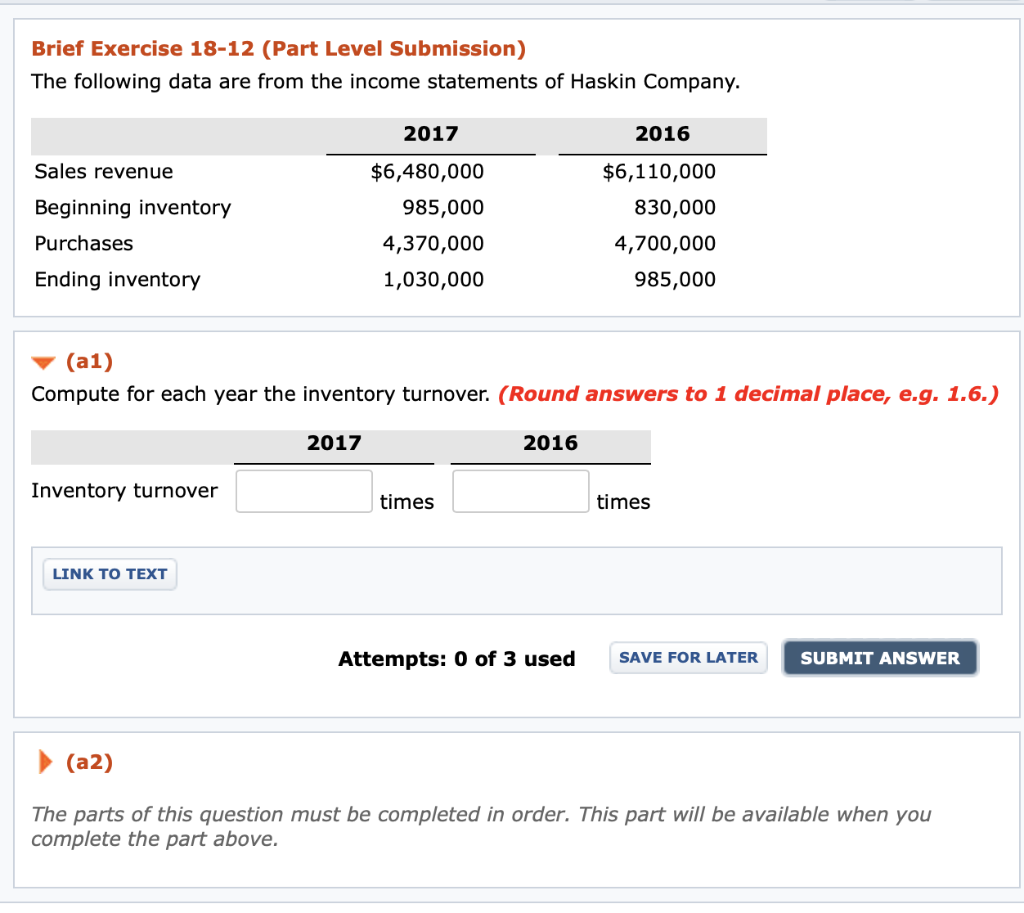
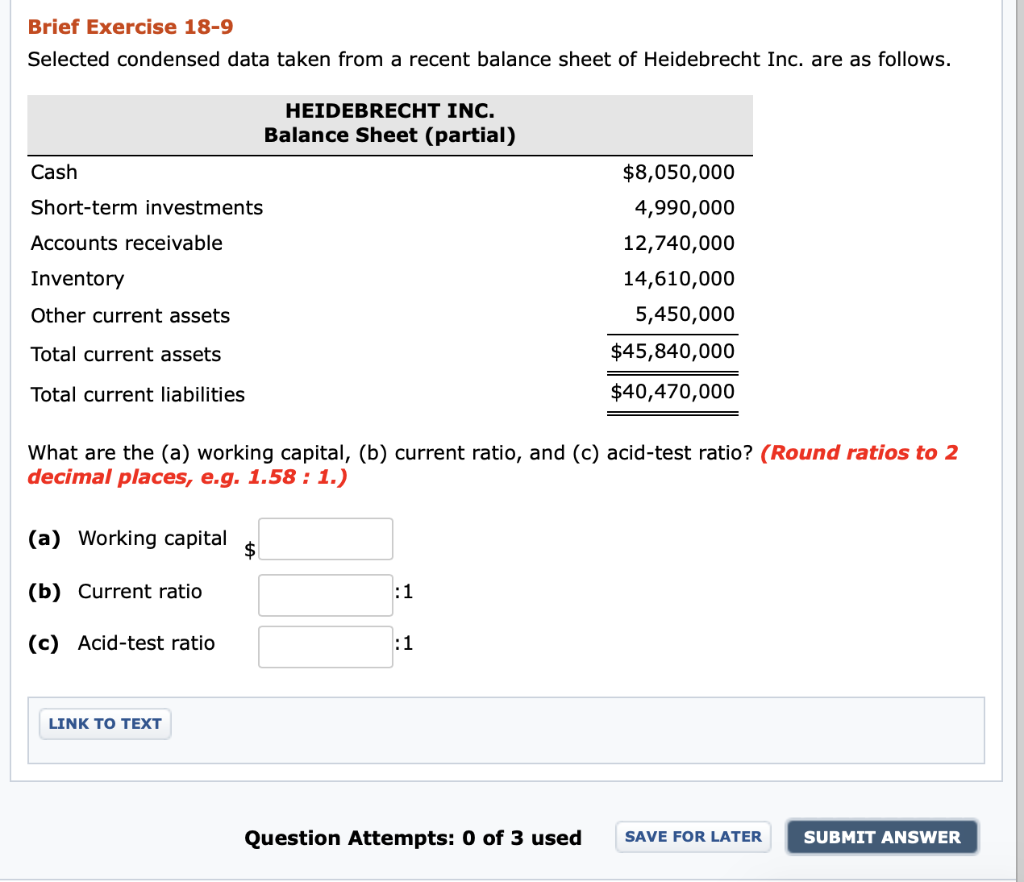
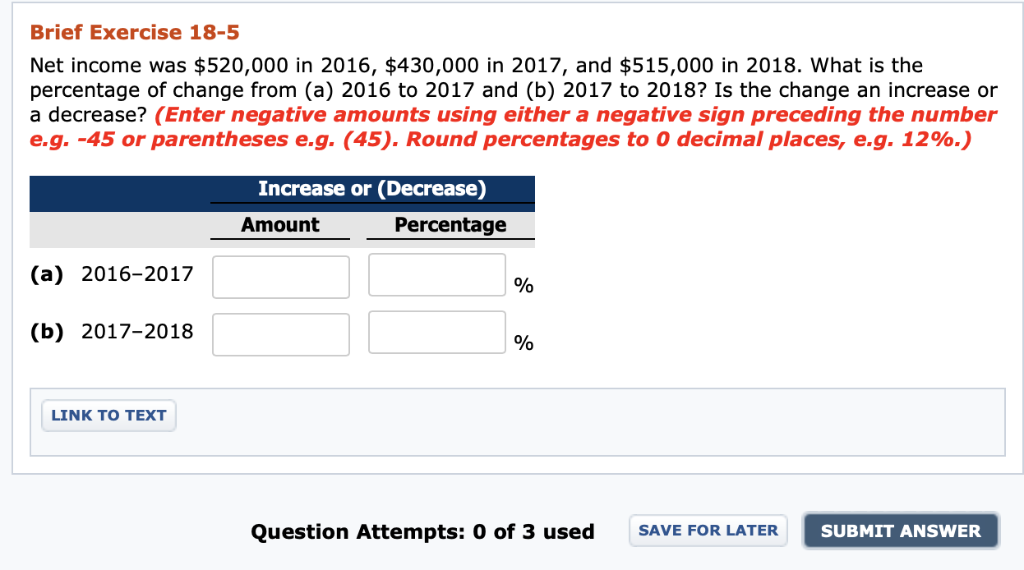
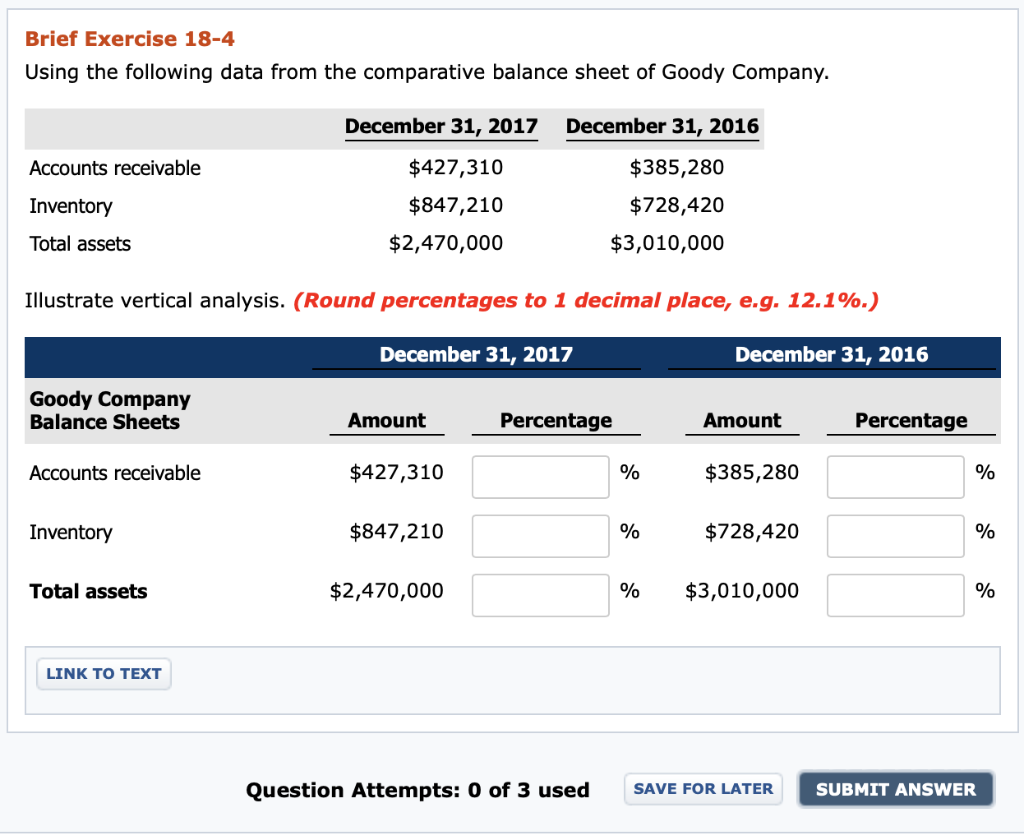
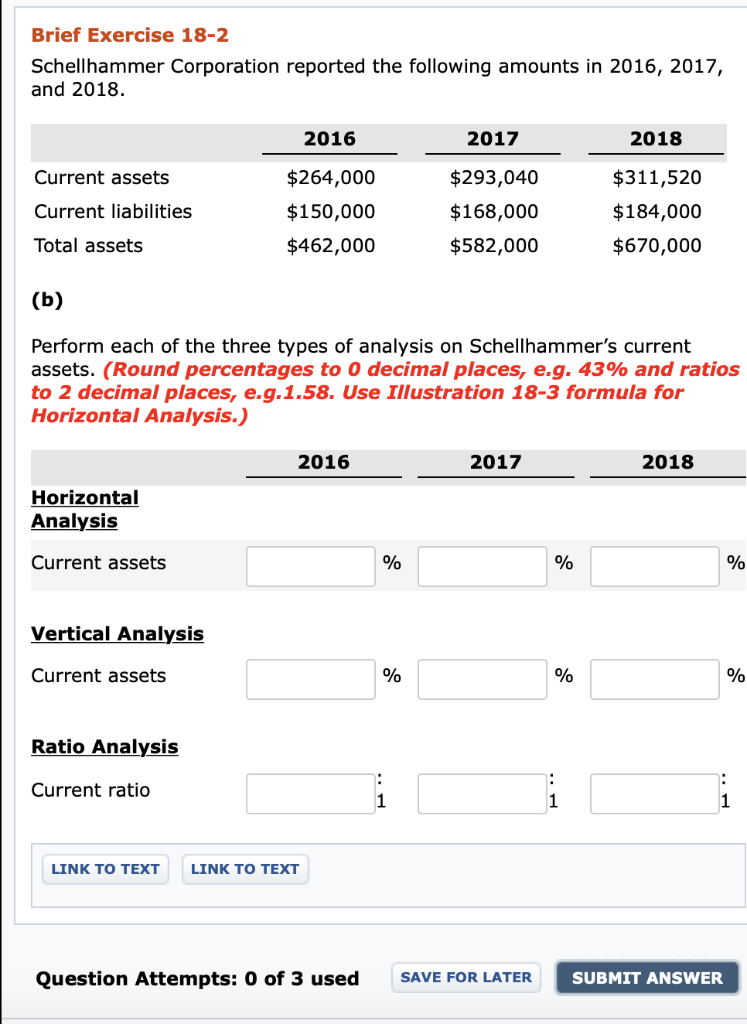
Brief Exercise 18-12 (Part Level Submission) The following data are from the income statements of Haskin Company. 2017 2016 Sales revenue Beginning inventory Purchases Ending inventory $6,480,000 $6,110,000 830,000 4,700,000 985,000 985,000 4,370,000 1,030,000 (al) Compute for each year the inventory turnover. (Round answers to 1 decimal place,e.g. 1.6.) 2017 2016 Inventory turnover times times LINK TO TEXT Attempts: 0 of 3 used SAVE FOR LATER SUBMIT ANSWER (a2) The parts of this question must be completed in order. This part will be available when you complete the part above. Brief Exercise 18-9 Selected condensed data taken from a recent balance sheet of Heidebrecht Inc. are as follows. HEIDEBRECHT INC. Balance Sheet (partial) Cash Short-term investments Accounts receivable Inventory Other current assets Total current assets Total current liabilities $8,050,000 4,990,000 12,740,000 14,610,000 5,450,000 $45,840,000 $40,470,000 What are the (a) working capital, (b) current ratio, and (c) acid-test ratio? (Round ratios to 2 decimal places, e.g. 1.58:1.) (a) Working capital (b) Current ratio (c) Acid-test ratio LINK TO TEXT Question Attempts: 0 of 3 used SAVE FOR LATER SUBMIT ANSWER Brief Exercise 18-5 Net income was $520,000 in 2016, $430,000 in 2017, and $515,000 in 2018. What is the percentage of change from (a) 2016 to 2017 and (b) 2017 to 2018? Is the change an increase or a decrease? (Enter negative amounts using either a negative sign preceding the number e.g.-45 or parentheses e.g. (45). Round percentages to 0 decimal places, e.g. 12%.) Increase or (Decrease) Amount Percentage (a) 2016-2017 (b) 2017-2018 LINK TO TEXT Question Attempts: 0 of 3 usedSAVE FOR LATER SUBMIT ANSWER Brief Exercise 18-4 Using the following data from the comparative balance sheet of Goody Company. December 31, 2017 December 31, 2016 $427,3100 $847,210 $2,470,000 $385,280 $728,420 $3,010,000 Accounts receivable Inventory Total assets Illustrate vertical analysis. (Round percentages to 1 decimal place, e.g. 12.1%.) December 31, 2017 December 31, 2016 Goody Company Balance Sheets Amount Percentage Amount Percentage $427,310 $847,210 $2,470,000 $385,280 $728,420 % $3,010,000 Accounts receivable 0 Inventory 0 Total assets 0 LINK TO TEXT Question Attempts: 0 of 3 used SAVE FOR LATER SUBMIT ANSWER BriefExercise 18-2 Schellhammer Corporation reported the following amounts in 2016, 2017, and 2018. 2016 $264,000 $150,000 $462,000 2017 $293,040 $168,000 $582,000 2018 $311,520 $184,000 $670,000 Current assets Current liabilities Total assets Perform each of the three types of analysis on Schellhammer's current assets. (Round percentages to 0 decimal places, eg, 43% and ratios to 2 decimal places, e.g.1.58. Use Illustration 18-3 formula for Horizontal Analysis.) 2016 2017 2018 Horizontal Analysis Current assets Vertical Analysis Current assets Ratio Analysis Current ratio 1 1 LINK TO TEXT LINK TO TEXT Question Attempts: 0 of 3 used