Build 5 years forecast model for H&R Block. Make sure to show how you got answers by include formulas!
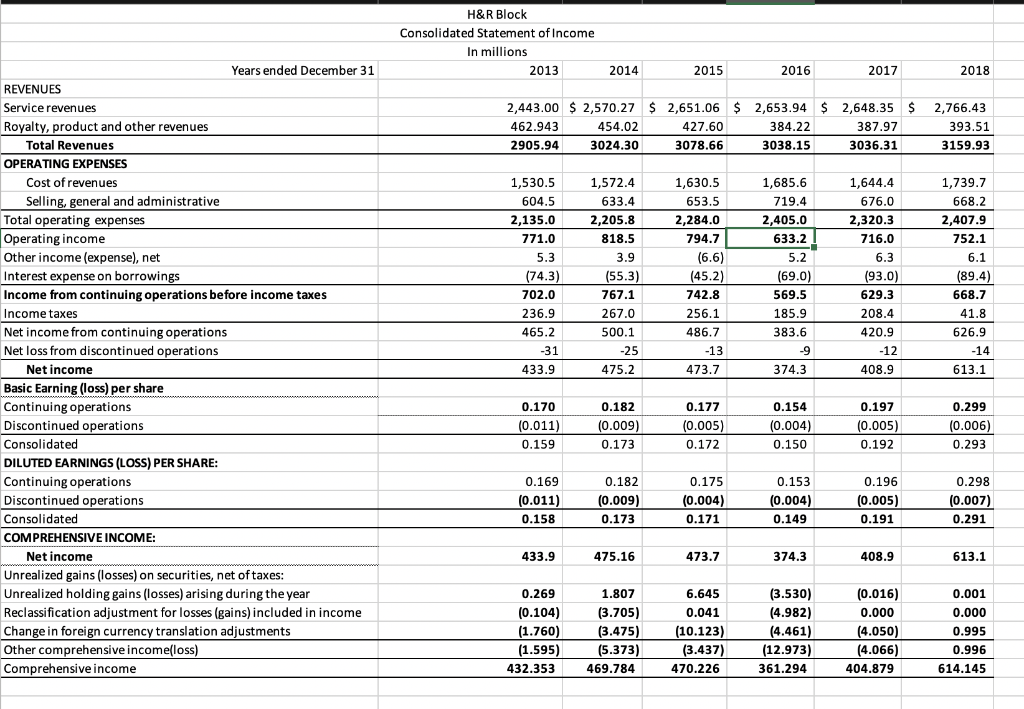
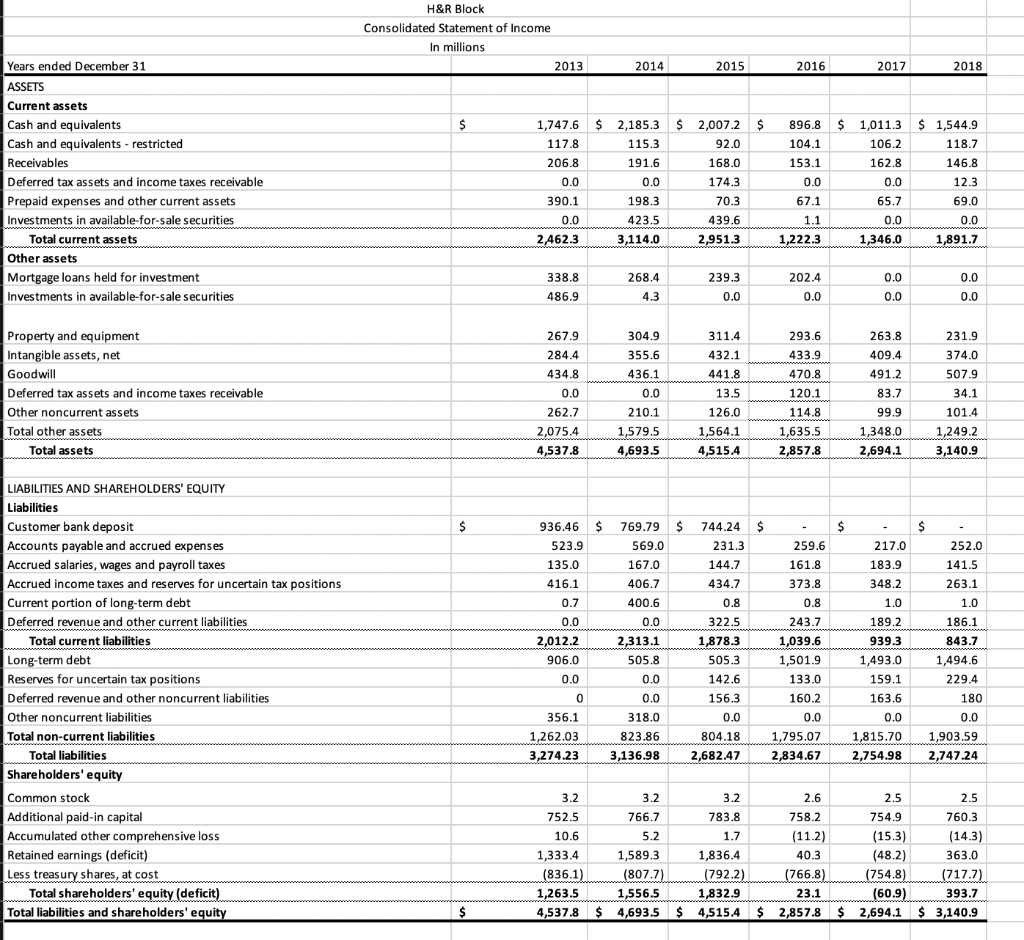
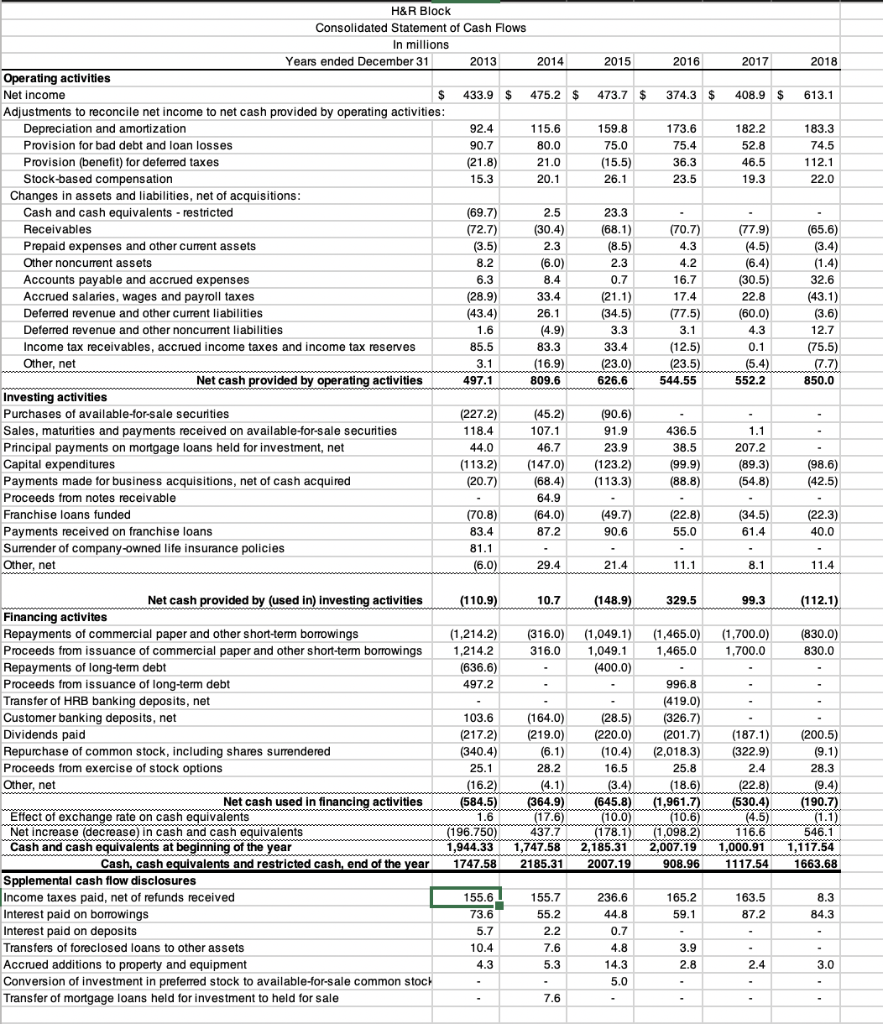
H&R Block Consolidated Statement of Income In millions 2014 2016 2017 2018 2013 2015 Years ended December 31 REVENUES Service revenues Royalty, product and other revenues 2,443.00 2,570.27 2,651.06 2,653.94 $ 2,648.35$ 2,766.43 462.943 2905.94 393.51 454.02 3024.30 384.22 3038.15 387.97 3036.31 3159.93 3078.66 Total Revenues 1,630.5 653.5 2,284.0 794.7 1,739.7 668.2 2,407.9 752.1 OPERATING EXPENSES 1,685.6 1,644.4 1,530.5 Cost of revenues Selling, general and administrative Total operating expenses 633.4 2,205.8 818.5 2,405.0 633.2 2,320.3 716.0 2,135.0 Operatingincome Other income (expense), net Interest expense on borrowings Income from continuing operations before income taxes Income taxes Net income from continuing operations Net loss from discontinued operations 629.3 668.7 742.8 702.0 236.9 465.2 767.1 267.0 500.1 185.9 383.6 486.7 420.9 626.9 -9 473.7 374.3 408.9 433.9 Net income Basic Earning (loss) per share Continuing operations Discontinued operations Consolidated DILUTED EARNINGS (LOSS) PER SHARE: Continuing operations Discontinued operations Consolidated COMPREHENSIVEINCOME: 0.299 0.006) 0.293 0.154 0.197 0.182 0.170 (0.011) 0.159 (0.005) 0.172 0.150 0.298 007) 0.291 0.196 0.169 (0.009) (0.004) 0.158 408.9 433.9 Net income Unrealized gains (losses) on securities, net of taxes: Unrealized holding gains (losses) arising during the year Reclassification adjustment for losses (gains) included in income Change in foreign currency translation adjustments Other comprehensive income(loss) Comprehensive income (0.016) 0.000 (4.050) (4.066) 404.879 0.001 0.000 0.995 0.996 614.145 0.269 1.807 6.645 (4.982) 705) 475) (1.760) 1.595) (3.437(12.973) 361.294 432.353 469.784 470.226 H&R Block Consolidated Statement of Income In millions 2015 2016 2017 2018 2013 Years ended December 31 ASSETS Current assets Cash and equivalents Cash and equivalents - restricted Receivables Deferred tax assets and income taxes receivable Prepaid expenses and other current assets Investments in available-for-sale securities 1,747.6 2,185.3 115.3 2,007.2 896.81,011.3 1,544.9 118.7 104.1 153.1 106.2 162.8 168.0 174.3 206.8 390.1 198.3 423.5 Total current assets Other assets Mortgage loans held for investment Investments in available-for-sale securitie 268.4 239.3 338.8 486.9 231.9 293.6 433.9 470.8 120.1 263.8 409.4 491.2 267.9 284.4 311.4 432.1 Property and equipment Intangible assets, net Goodwill Deferred tax assets and income taxes receivable Other noncurrent assets Total other assets 355.6 436.1 507.9 210.1 1014 126.0 262.7 2,075.4 1,635.5 2,694.1 3,140.9 4,693.5 Total assets LIABILITIES AND SHAREHOLDERS' EQUITY Liabilities Customer bank deposit Accounts payable and accrued expenses Accrued salaries, wages and payroll taxes Accrued income taxes and reserves for uncertain tax positions Current portion of long-term debt Deferred revenue and other current liabilities 936.46 $ 769.79 744.24$ 569.0 167.0 406.7 400.6 259.6 161.8 373.8 217.0 183.9 348.2 252.0 523.9 135.0 416.1 231.3 144.7 263.1 186.1 843.7 05.3 1,501.9 1,493.0 1,4946 2294 322.5 189.2 939.3 Total current liabilities Long-term debt Reserves for uncertain tax positions Deferred revenue and other noncurrent liabilities Other noncurrent liabilities Total non-current liabilities 906.0 505.8 159.1 0 156.3 160.2 163.6 318.0 823.86 3,136.98 356.1 1,795.07 2,834.67 1,815.70 1,903.59 2,754.98 2,747.24 804.18 3,274.23 2,682.47 Total liabilities Shareholders' equity Common stock Additional paid-in capital Accumulated other comprehensive loss Retained earnings (deficit) Less treasury shares, at cost 766.7 783.8 758.2 760.3 752.5 363.0 836.1 807.7 792.2 766.8 Total shareholders' equity (defic Total liabilities and shareholders' equit 4,537.8 4,693.5$4,515.42,857.82,694.1 3,140.9 H&R Block Consolidated Statement of Cash Flows In millions Years ended December 31 Operating activities Net income S 433.9$ 475.2$473.7 $ 374.3 408.9 $ 613.1 Adjustments to reconcile net income to net cash provided by operating activities Depreciation and amortization Provision for bad debt and loan losses Provision (benefit) for deferred taxes Stock-based compensation 173.6 182.2 183.3 Changes in assets and liabilities, net of acquisitions Cash and cash equivalents -restricted Receivables Prepaid expenses and other current assets Other noncurent assets Accounts payable and accrued expenses Accrued salaries, wages and payroll taxes Deferred revenue and other current liabilities Deferred revenue and other noncurrent liabilities Income tax receivables, accrued income taxes and income tax reserves 2.7) 0.7) 0) 7.5) er Net cash provided by operating activities 497.1 809.6 626.6 544.55 552.2 850.0 Investing activities Purchases of available-for-sale securities Sales, maturities and payments received on available-for-sale securities Principal payments on mortgage loans held for investment, net Capital expenditures Payments made for business acquisitions, net of cash acquired Proceeds from notes receivable Franchise loans funded Payments received on franchise loans Surrender of company-owned life insurance policies Other, net 0.6) 436.5 46.7 113.2(147.0) 123.2) 207.2 (70.8)(64.0) 49.7) (22.8) (34.5) (22.3) 87.2 0 Net cash provided in) investing activities Financing activites Repayments of commercial paper and other short-term borrowings Proceeds from issuance of commercial paper and other short-term borrowings Repayments of long-term debt Proceeds from issuance of long-term debt Transfer of HRB banking deposits, net Customer banking deposits, net Dividends paid Repurchase of common stock, including shares surrendered Proceeds from exercise of stock options Other, net 1,214.2) (316.0) 1,049.1) 316.01,049.1 (400.0) 1,465.0) (1,700.0) (830.0) 1,700.0 1,465.0 830.0 497.2 996.8 103.6 164.0)(28.5) (326.7) (217.2)(219.0)(220.0)(201187.1) 200.5) (340.4) 10.4)(2,018.3 (322.9) Net cash used in financing activities (584.5) (364.9) (645.8) Effect of exchange rate on cash equivalents Net increase (decrease) in cash and cash equivalents Cash and cash 546.1 1,944.33 1,747.58 2,185.32,007.19 1,000.91 1,117.54 196.75 178.1,098.2) valents at beginning of the vear Cash, cash equivalents and restricted cash, end of the year 747.58 2185.31 2007.19 908.961117.541663.68 Spplemental cash flow disclosures Income taxes paid, net of refunds received Interest paid on borowings Interest paid on deposits Transfers of foreclosed loans to other assets Accrued additions to property and equipment Conversion of investment in preferred stock to available-for-sale common stoc Transfer of mortgage loans held for investment to held for sale 236.6 165.2 163.5 73.155,7 H&R Block Consolidated Statement of Income In millions 2014 2016 2017 2018 2013 2015 Years ended December 31 REVENUES Service revenues Royalty, product and other revenues 2,443.00 2,570.27 2,651.06 2,653.94 $ 2,648.35$ 2,766.43 462.943 2905.94 393.51 454.02 3024.30 384.22 3038.15 387.97 3036.31 3159.93 3078.66 Total Revenues 1,630.5 653.5 2,284.0 794.7 1,739.7 668.2 2,407.9 752.1 OPERATING EXPENSES 1,685.6 1,644.4 1,530.5 Cost of revenues Selling, general and administrative Total operating expenses 633.4 2,205.8 818.5 2,405.0 633.2 2,320.3 716.0 2,135.0 Operatingincome Other income (expense), net Interest expense on borrowings Income from continuing operations before income taxes Income taxes Net income from continuing operations Net loss from discontinued operations 629.3 668.7 742.8 702.0 236.9 465.2 767.1 267.0 500.1 185.9 383.6 486.7 420.9 626.9 -9 473.7 374.3 408.9 433.9 Net income Basic Earning (loss) per share Continuing operations Discontinued operations Consolidated DILUTED EARNINGS (LOSS) PER SHARE: Continuing operations Discontinued operations Consolidated COMPREHENSIVEINCOME: 0.299 0.006) 0.293 0.154 0.197 0.182 0.170 (0.011) 0.159 (0.005) 0.172 0.150 0.298 007) 0.291 0.196 0.169 (0.009) (0.004) 0.158 408.9 433.9 Net income Unrealized gains (losses) on securities, net of taxes: Unrealized holding gains (losses) arising during the year Reclassification adjustment for losses (gains) included in income Change in foreign currency translation adjustments Other comprehensive income(loss) Comprehensive income (0.016) 0.000 (4.050) (4.066) 404.879 0.001 0.000 0.995 0.996 614.145 0.269 1.807 6.645 (4.982) 705) 475) (1.760) 1.595) (3.437(12.973) 361.294 432.353 469.784 470.226 H&R Block Consolidated Statement of Income In millions 2015 2016 2017 2018 2013 Years ended December 31 ASSETS Current assets Cash and equivalents Cash and equivalents - restricted Receivables Deferred tax assets and income taxes receivable Prepaid expenses and other current assets Investments in available-for-sale securities 1,747.6 2,185.3 115.3 2,007.2 896.81,011.3 1,544.9 118.7 104.1 153.1 106.2 162.8 168.0 174.3 206.8 390.1 198.3 423.5 Total current assets Other assets Mortgage loans held for investment Investments in available-for-sale securitie 268.4 239.3 338.8 486.9 231.9 293.6 433.9 470.8 120.1 263.8 409.4 491.2 267.9 284.4 311.4 432.1 Property and equipment Intangible assets, net Goodwill Deferred tax assets and income taxes receivable Other noncurrent assets Total other assets 355.6 436.1 507.9 210.1 1014 126.0 262.7 2,075.4 1,635.5 2,694.1 3,140.9 4,693.5 Total assets LIABILITIES AND SHAREHOLDERS' EQUITY Liabilities Customer bank deposit Accounts payable and accrued expenses Accrued salaries, wages and payroll taxes Accrued income taxes and reserves for uncertain tax positions Current portion of long-term debt Deferred revenue and other current liabilities 936.46 $ 769.79 744.24$ 569.0 167.0 406.7 400.6 259.6 161.8 373.8 217.0 183.9 348.2 252.0 523.9 135.0 416.1 231.3 144.7 263.1 186.1 843.7 05.3 1,501.9 1,493.0 1,4946 2294 322.5 189.2 939.3 Total current liabilities Long-term debt Reserves for uncertain tax positions Deferred revenue and other noncurrent liabilities Other noncurrent liabilities Total non-current liabilities 906.0 505.8 159.1 0 156.3 160.2 163.6 318.0 823.86 3,136.98 356.1 1,795.07 2,834.67 1,815.70 1,903.59 2,754.98 2,747.24 804.18 3,274.23 2,682.47 Total liabilities Shareholders' equity Common stock Additional paid-in capital Accumulated other comprehensive loss Retained earnings (deficit) Less treasury shares, at cost 766.7 783.8 758.2 760.3 752.5 363.0 836.1 807.7 792.2 766.8 Total shareholders' equity (defic Total liabilities and shareholders' equit 4,537.8 4,693.5$4,515.42,857.82,694.1 3,140.9 H&R Block Consolidated Statement of Cash Flows In millions Years ended December 31 Operating activities Net income S 433.9$ 475.2$473.7 $ 374.3 408.9 $ 613.1 Adjustments to reconcile net income to net cash provided by operating activities Depreciation and amortization Provision for bad debt and loan losses Provision (benefit) for deferred taxes Stock-based compensation 173.6 182.2 183.3 Changes in assets and liabilities, net of acquisitions Cash and cash equivalents -restricted Receivables Prepaid expenses and other current assets Other noncurent assets Accounts payable and accrued expenses Accrued salaries, wages and payroll taxes Deferred revenue and other current liabilities Deferred revenue and other noncurrent liabilities Income tax receivables, accrued income taxes and income tax reserves 2.7) 0.7) 0) 7.5) er Net cash provided by operating activities 497.1 809.6 626.6 544.55 552.2 850.0 Investing activities Purchases of available-for-sale securities Sales, maturities and payments received on available-for-sale securities Principal payments on mortgage loans held for investment, net Capital expenditures Payments made for business acquisitions, net of cash acquired Proceeds from notes receivable Franchise loans funded Payments received on franchise loans Surrender of company-owned life insurance policies Other, net 0.6) 436.5 46.7 113.2(147.0) 123.2) 207.2 (70.8)(64.0) 49.7) (22.8) (34.5) (22.3) 87.2 0 Net cash provided in) investing activities Financing activites Repayments of commercial paper and other short-term borrowings Proceeds from issuance of commercial paper and other short-term borrowings Repayments of long-term debt Proceeds from issuance of long-term debt Transfer of HRB banking deposits, net Customer banking deposits, net Dividends paid Repurchase of common stock, including shares surrendered Proceeds from exercise of stock options Other, net 1,214.2) (316.0) 1,049.1) 316.01,049.1 (400.0) 1,465.0) (1,700.0) (830.0) 1,700.0 1,465.0 830.0 497.2 996.8 103.6 164.0)(28.5) (326.7) (217.2)(219.0)(220.0)(201187.1) 200.5) (340.4) 10.4)(2,018.3 (322.9) Net cash used in financing activities (584.5) (364.9) (645.8) Effect of exchange rate on cash equivalents Net increase (decrease) in cash and cash equivalents Cash and cash 546.1 1,944.33 1,747.58 2,185.32,007.19 1,000.91 1,117.54 196.75 178.1,098.2) valents at beginning of the vear Cash, cash equivalents and restricted cash, end of the year 747.58 2185.31 2007.19 908.961117.541663.68 Spplemental cash flow disclosures Income taxes paid, net of refunds received Interest paid on borowings Interest paid on deposits Transfers of foreclosed loans to other assets Accrued additions to property and equipment Conversion of investment in preferred stock to available-for-sale common stoc Transfer of mortgage loans held for investment to held for sale 236.6 165.2 163.5 73.155,7