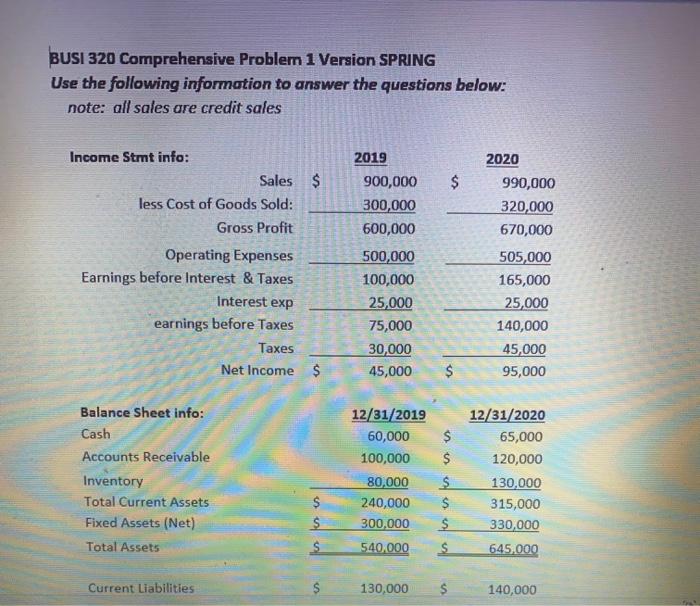
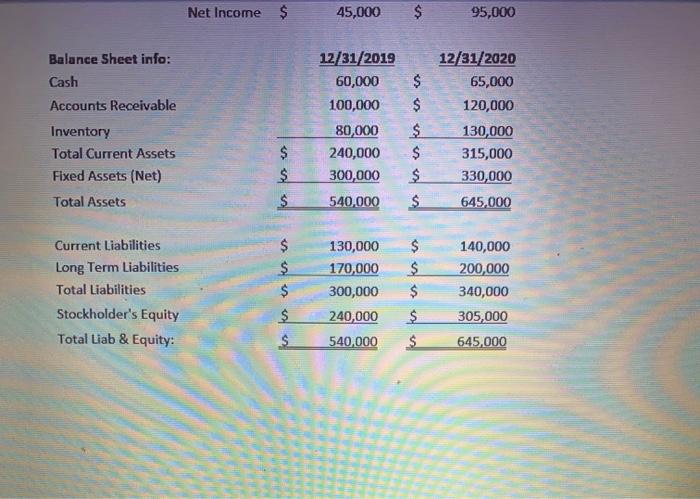
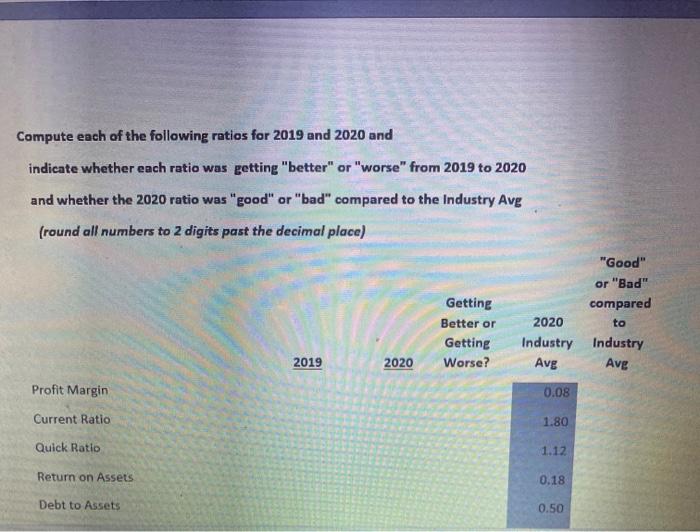
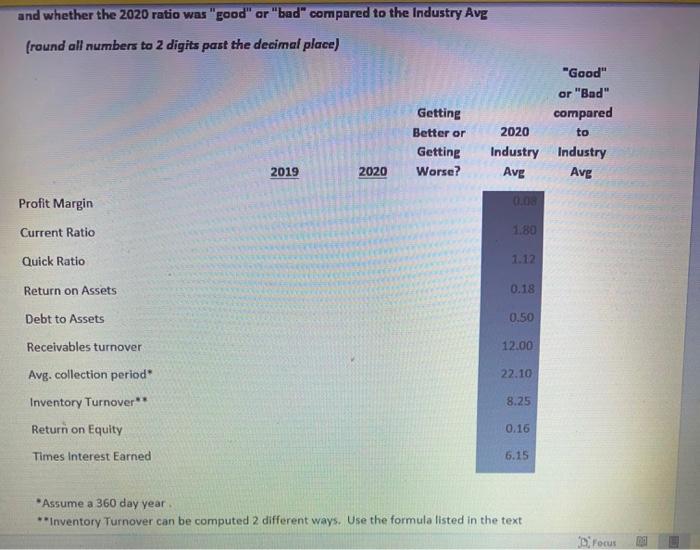
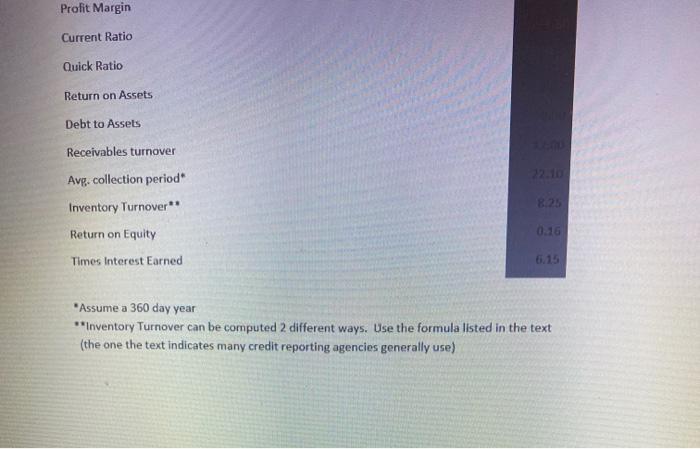
BUSI 320 Comprehensive Problem 1 Version SPRING Use the following information to answer the questions below: note: all sales are credit sales 2019 900,000 $ 300,000 600,000 Income Stmt info: Sales $ less Cost of Goods Sold: Gross Profit Operating Expenses Earnings before Interest & Taxes Interest exp earnings before Taxes Taxes Net Income $ 500,000 100,000 25,000 75,000 30,000 45,000 2020 990,000 320,000 670,000 505,000 165,000 25,000 140,000 45,000 95,000 $ Balance Sheet info: Cash Accounts Receivable Inventory Total Current Assets Fixed Assets (Net) Total Assets 12/31/2019 60,000 100,000 80,000 240,000 300,000 540,000 $ $ $ $ $ $ 12/31/2020 65,000 120,000 130,000 315,000 330,000 645,000 $ $ Current Liabilities 130,000 140,000 Net Income $ 45,000 $ 95,000 Balance Sheet info: Cash Accounts Receivable Inventory Total Current Assets Fixed Assets (Net) Total Assets 12/31/2019 60,000 100,000 80,000 240,000 300,000 540,000 $ $ $ $ $ $ 12/31/2020 65,000 120,000 130,000 315,000 330,000 $ $ $ 645,000 Current Liabilities Long Term Liabilities Total Liabilities Stockholder's Equity Total Liab & Equity: $ $ $ $ 130,000 170,000 300,000 240,000 540,000 $ $ $ 140,000 200,000 340,000 305,000 645,000 $ $ Compute each of the following ratios for 2019 and 2020 and indicate whether each ratio was getting "better" or "worse" from 2019 to 2020 and whether the 2020 ratio was "good" or "bad" compared to the Industry Avg (round all numbers to 2 digits past the decimal place) Getting Better or Getting Worse? "Good" or "Bad" compared 2020 to Industry Industry Avg Ave 2019 2020 Profit Margin 0.08 Current Ratio 1.80 Quick Ratio 1.12 Return on Assets 0.18 Debt to Assets 0.50 and whether the 2020 ratio was "good" or "bad" compared to the Industry Avg (round all numbers to 2 digits past the decimal place) Getting Better or Getting Worse? "Good" ar "Bad" compared 2020 to Industry Industry Avg 2019 2020 Avg Profit Margin 0.08 Current Ratio 1.80 Quick Ratio 1.12 Return on Assets 0.18 Debt to Assets 0.50 Receivables turnover 12.00 Avg. collection period 22.10 Inventory Turnover** 8.25 Return on Equity 0.16 Times Interest Earned 6.15 *Assume a 360 day year. * Inventory Turnover can be computed 2 different ways. Use the formula listed in the text Drocus Profit Margin Current Ratio Quick Ratio Return on Assets Debt to Assets Receivables turnover Avg. collection period Inventory Turnover 825 Return on Equity Times Interest Earned 6.15 *Assume a 360 day year **Inventory Turnover can be computed 2 different ways. Use the formula listed in the text (the one the text indicates many credit reporting agencies generally use)