Answered step by step
Verified Expert Solution
Question
1 Approved Answer
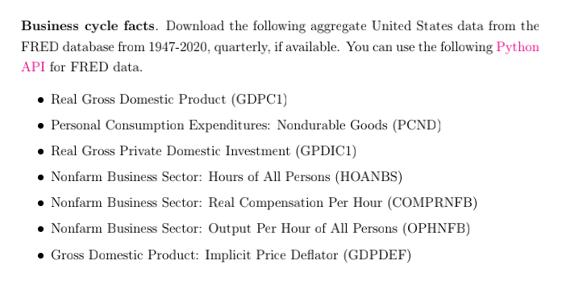
Business cycle facts. Download the following aggregate United States data from the FRED database from 1947-2020, quarterly, if available. You can use the following

![Civilian Noninstitutional Population (CNP160V) [monthly series, convert into quar- terly] Unemployment rate](https://dsd5zvtm8ll6.cloudfront.net/si.experts.images/questions/2021/09/61558ad205a63_1632996050151.jpg)

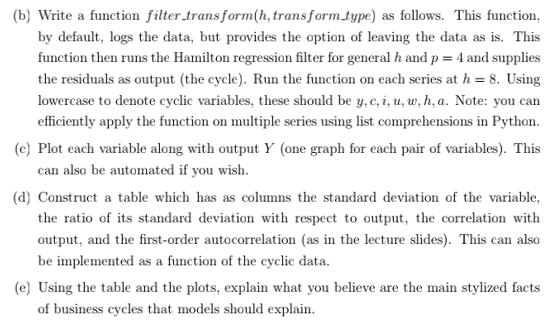
Business cycle facts. Download the following aggregate United States data from the FRED database from 1947-2020, quarterly, if available. You can use the following Python API for FRED data. Real Gross Domestic Product (GDPC1) Personal Consumption Expenditures: Nondurable Goods (PCND) Real Gross Private Domestic Investment (GPDICI) Nonfarm Business Sector: Hours of All Persons (HOANBS) Nonfarm Business Sector: Real Compensation Per Hour (COMPRNFB) Nonfarm Business Sector: Output Per Hour of All Persons (OPHNFB) Gross Domestic Product: Implicit Price Deflator (GDPDEF) Civilian Noninstitutional Population (CNP160V) [monthly series, convert into quar- terly] Unemployment rate (UNRATE) (a) Construct the following variables: Y: Divide real GDP by population C: Divide personal consumption expenditures by the price deflator and by the population I: Divide real investment by population H: Divide hours of all persons by population A: Use output per hour (b) Write a function filter_transform(h, transform type) as follows. This function, by default, logs the data, but provides the option of leaving the data as is. This function then runs the Hamilton regression filter for general h and p = 4 and supplies the residuals as output (the cycle). Run the function on each series at h = 8. Using lowercase to denote cyclic variables, these should be y, c, i, u, w, h, a. Note: you can efficiently apply the function on multiple series using list comprehensions in Python. (c) Plot each variable along with output Y (one graph for each pair of variables). This can also be automated if you wish. (d) Construct a table which has as columns the standard deviation of the variable, the ratio of its standard deviation with respect to output, the correlation with output, and the first-order autocorrelation (as in the lecture slides). This can also be implemented as a function of the cyclic data. (e) Using the table and the plots, explain what you believe are the main stylized facts of business cycles that models should explain.
Step by Step Solution
★★★★★
3.45 Rating (152 Votes )
There are 3 Steps involved in it
Step: 1
I can provide you with a general approach to tackle this task using Python and data analysis librari...
Get Instant Access to Expert-Tailored Solutions
See step-by-step solutions with expert insights and AI powered tools for academic success
Step: 2

Step: 3

Ace Your Homework with AI
Get the answers you need in no time with our AI-driven, step-by-step assistance
Get Started


