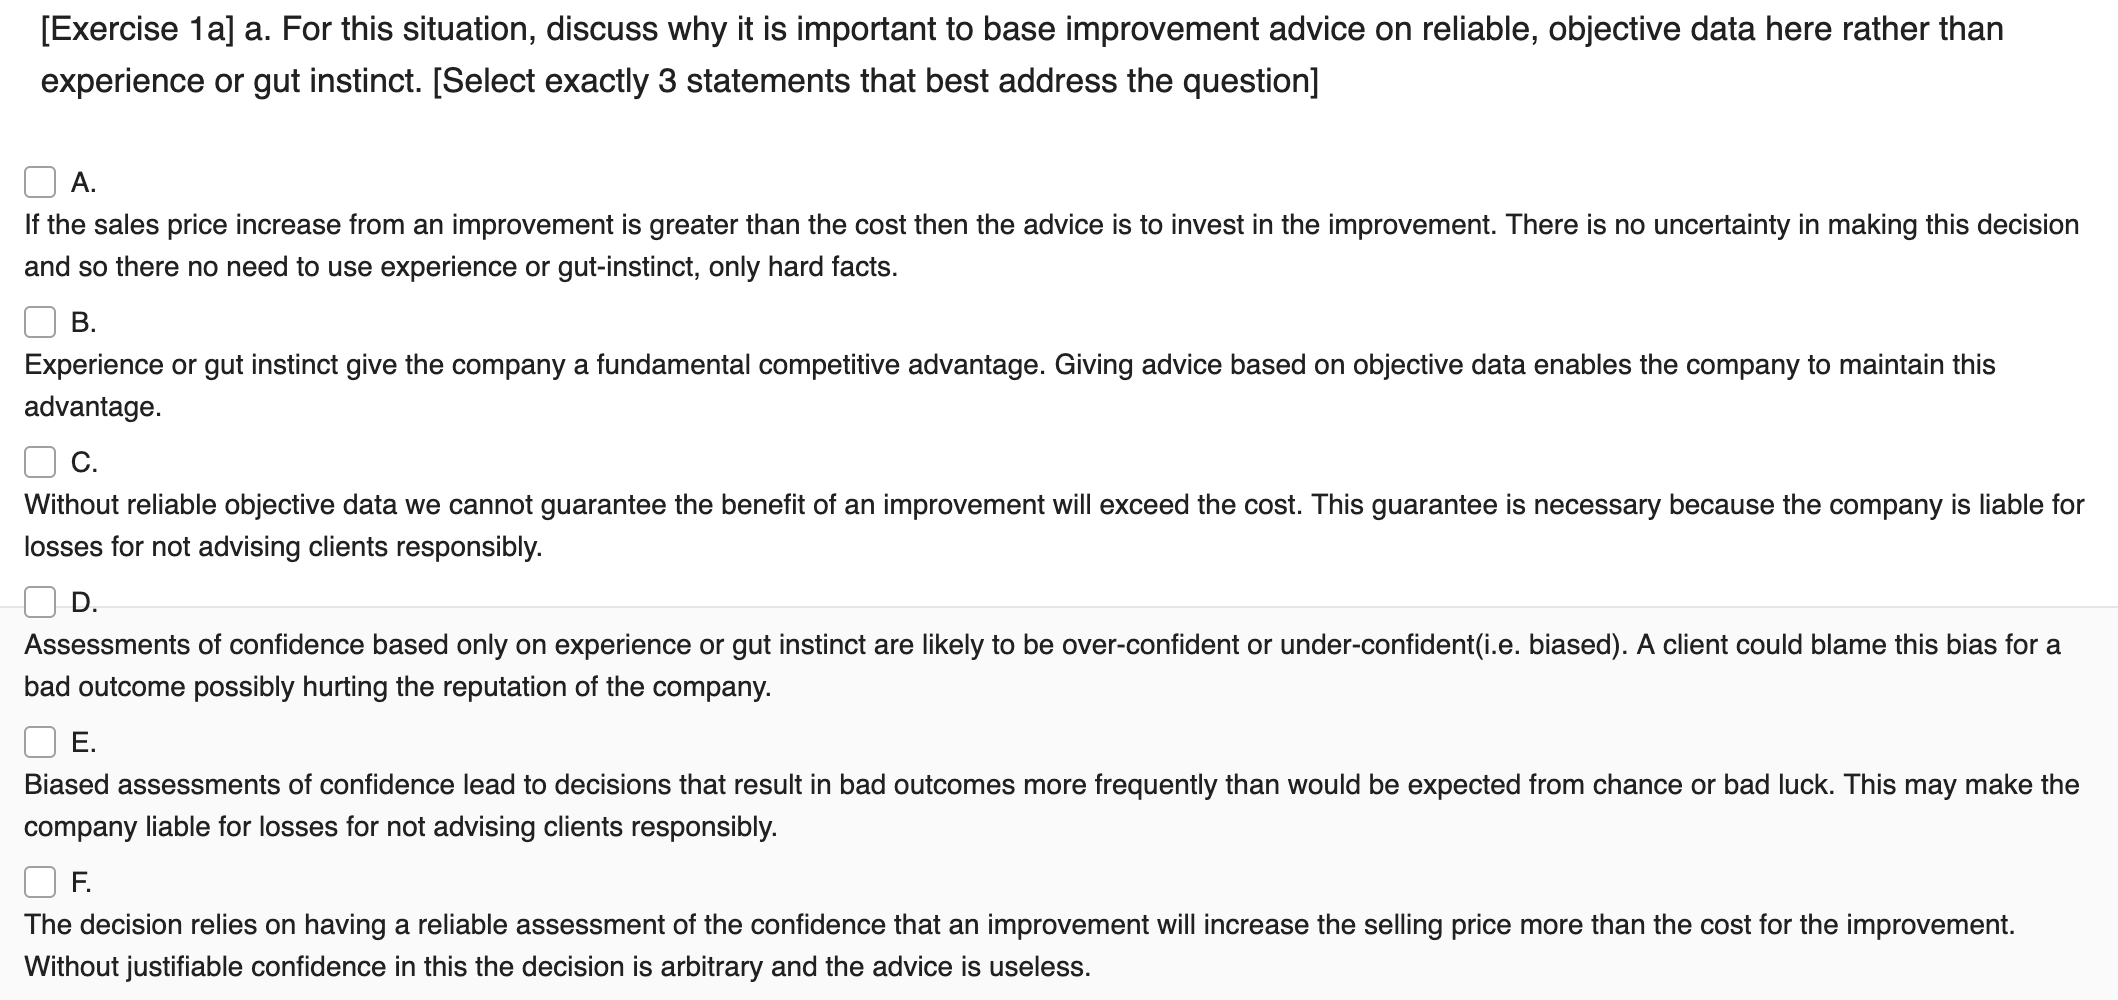
Question: BUSINESS STATISTICS [Exercise 1a) a. For this situation, discuss why it is important to base improvement advice on reliable, objective data here rather than experience
BUSINESS STATISTICS
![question] A. If the sales price increase from an improvement is greater](https://dsd5zvtm8ll6.cloudfront.net/si.experts.images/questions/2024/09/66e32cfb7b0dc_21866e32cfacb064.jpg)


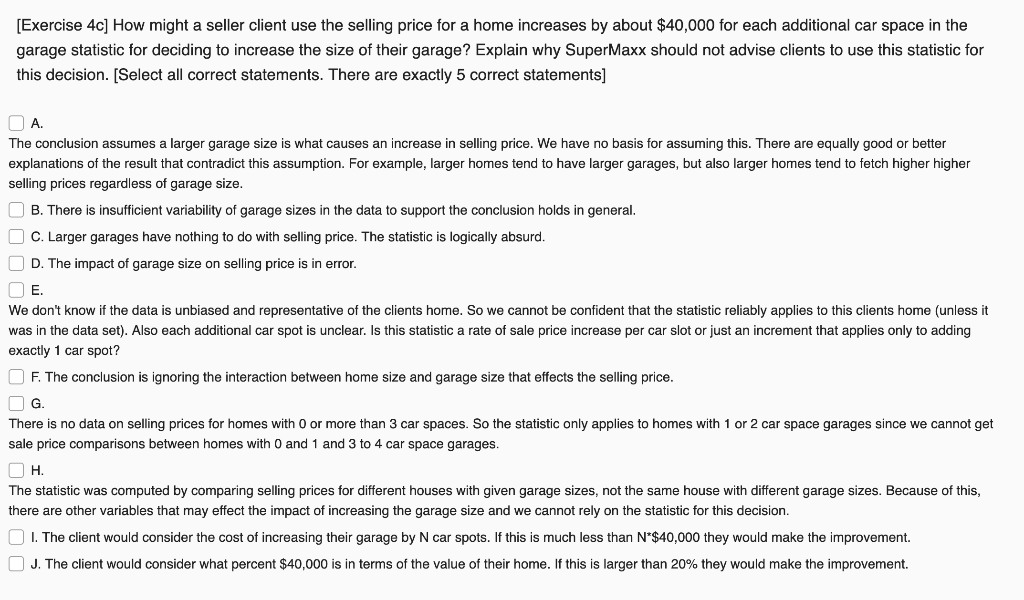
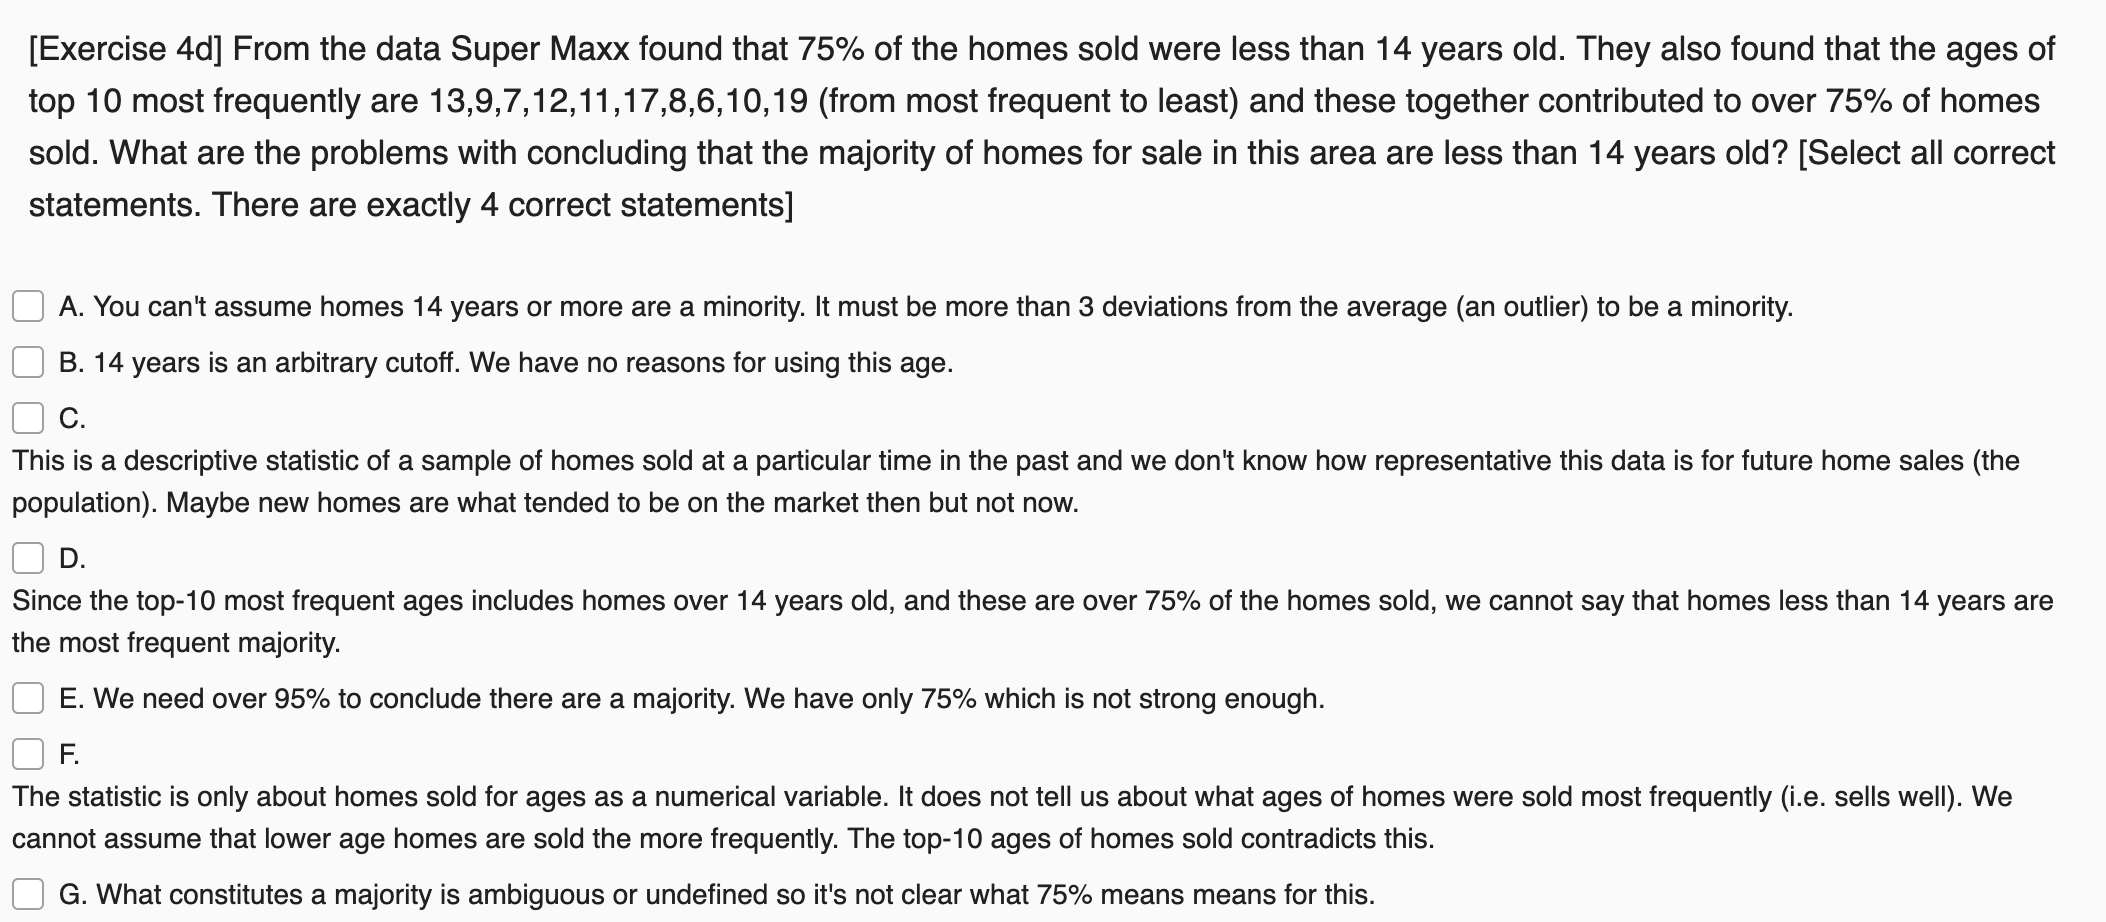
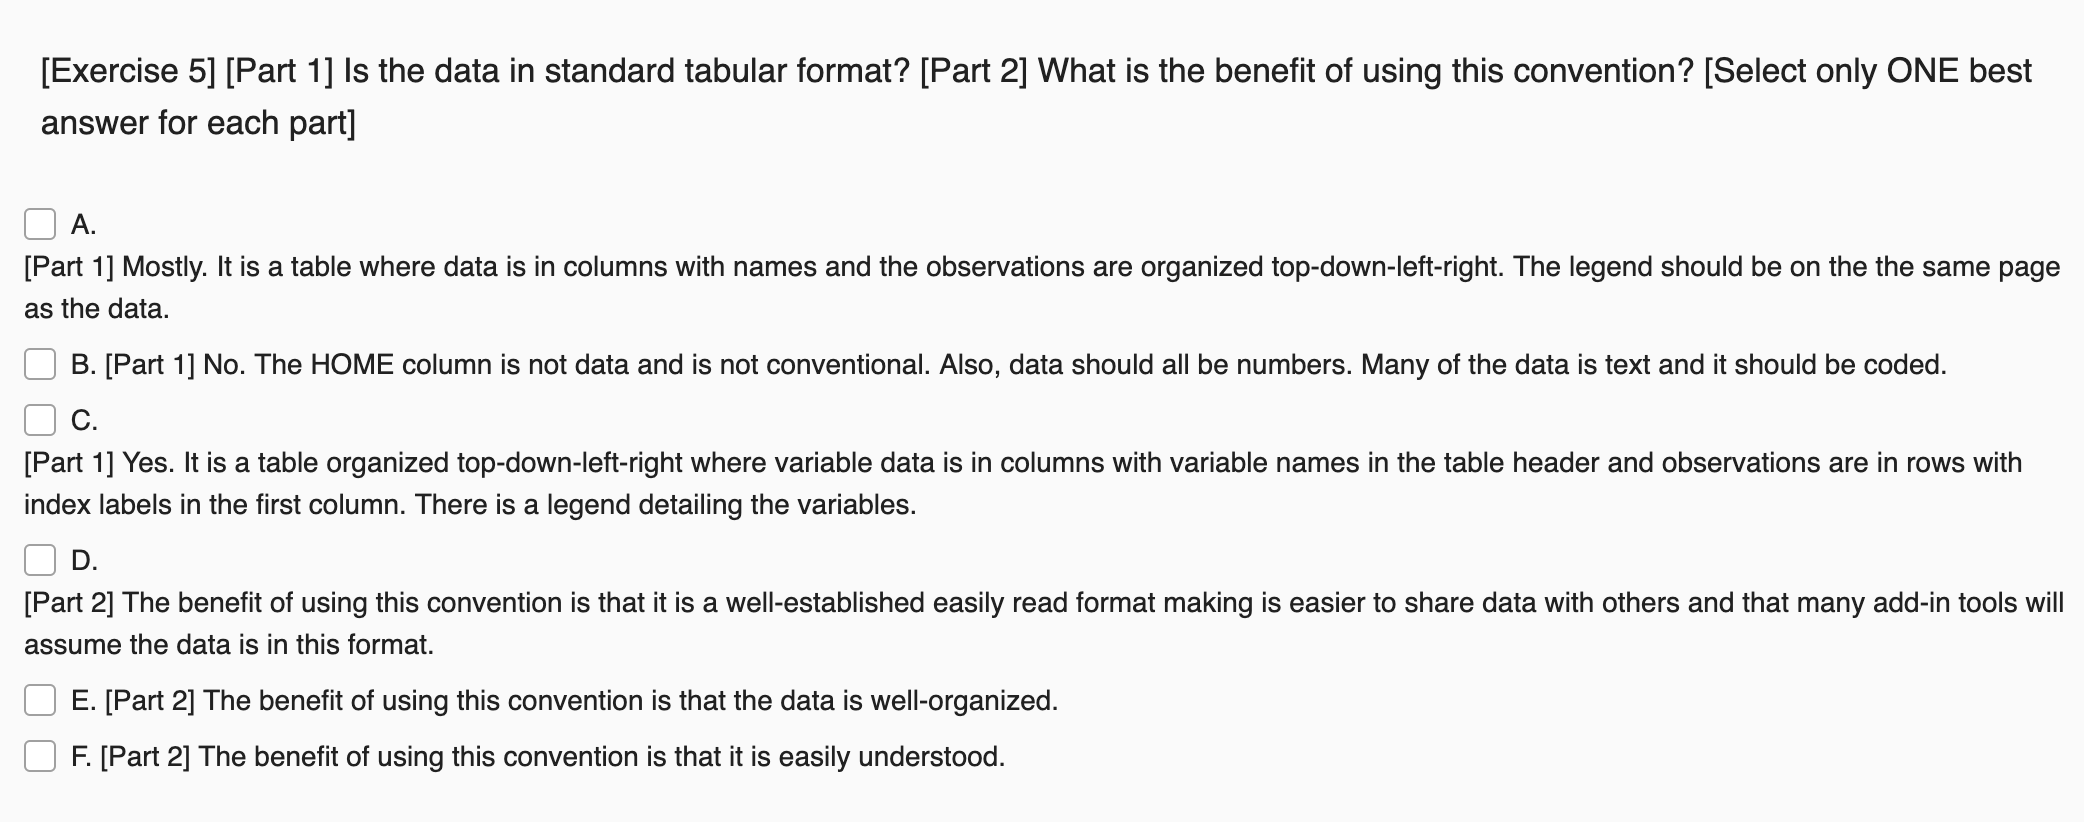
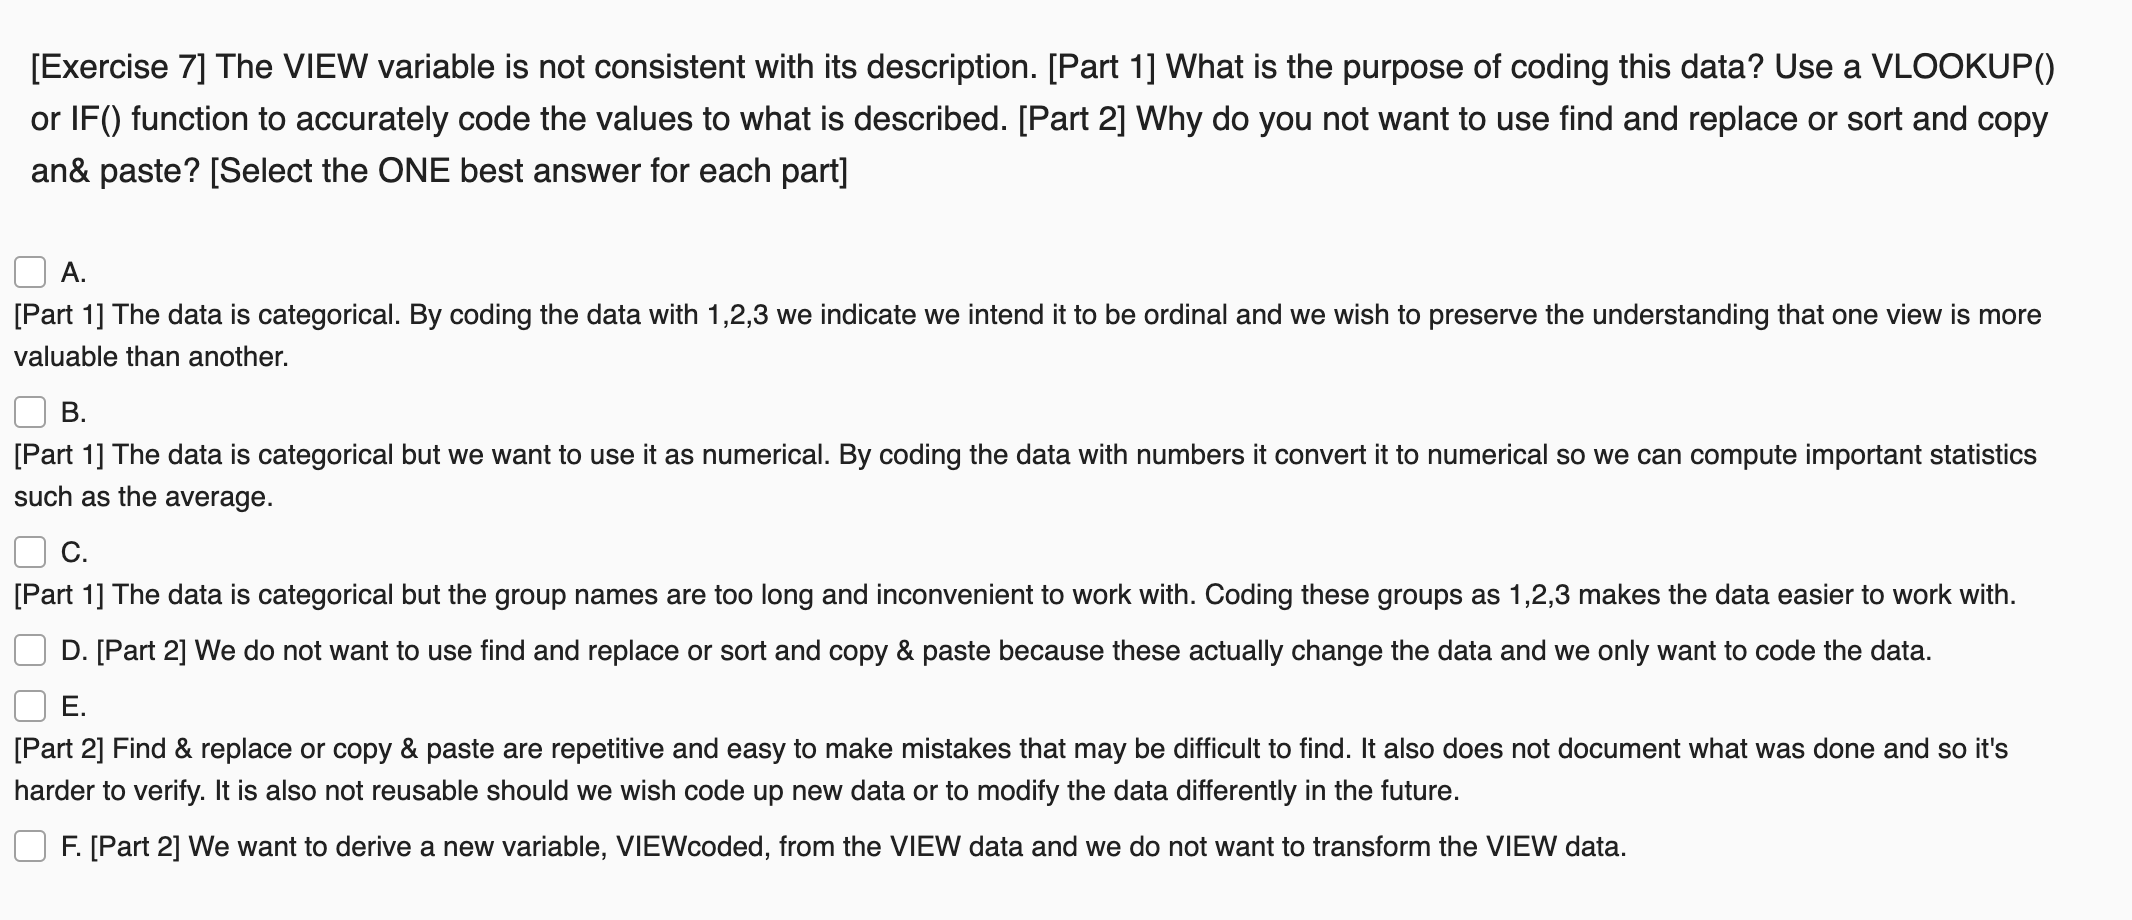
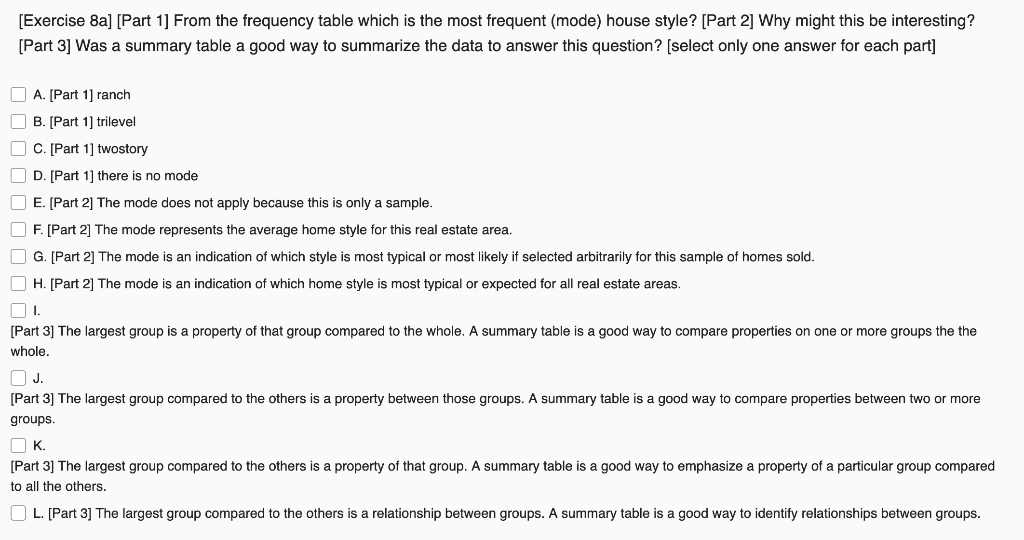
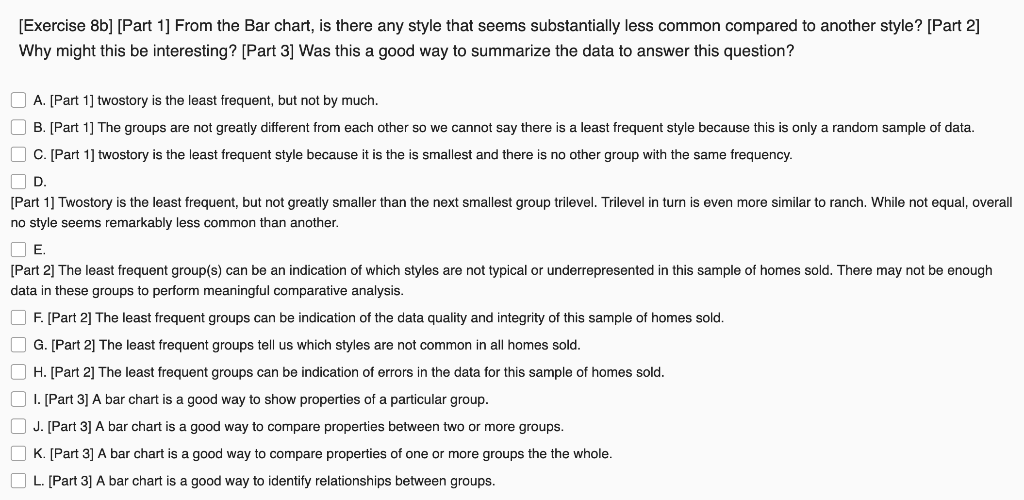
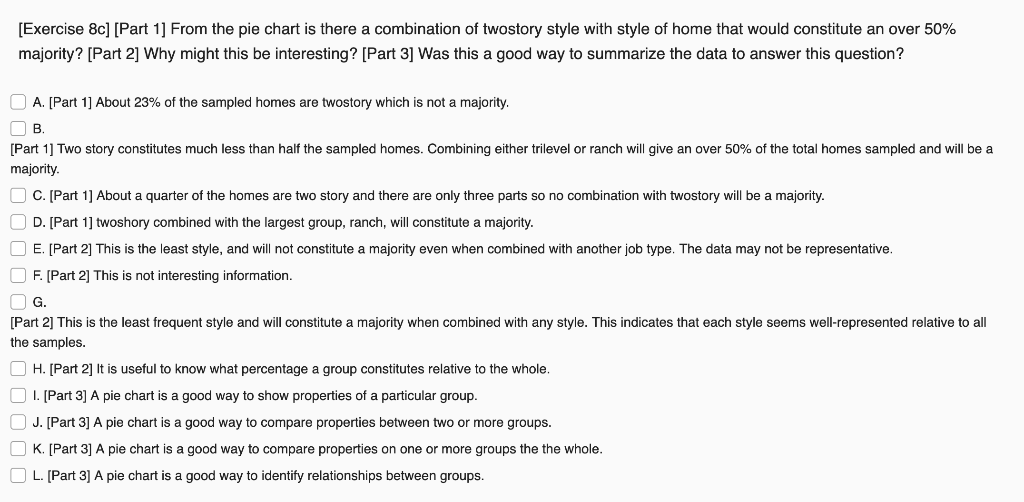
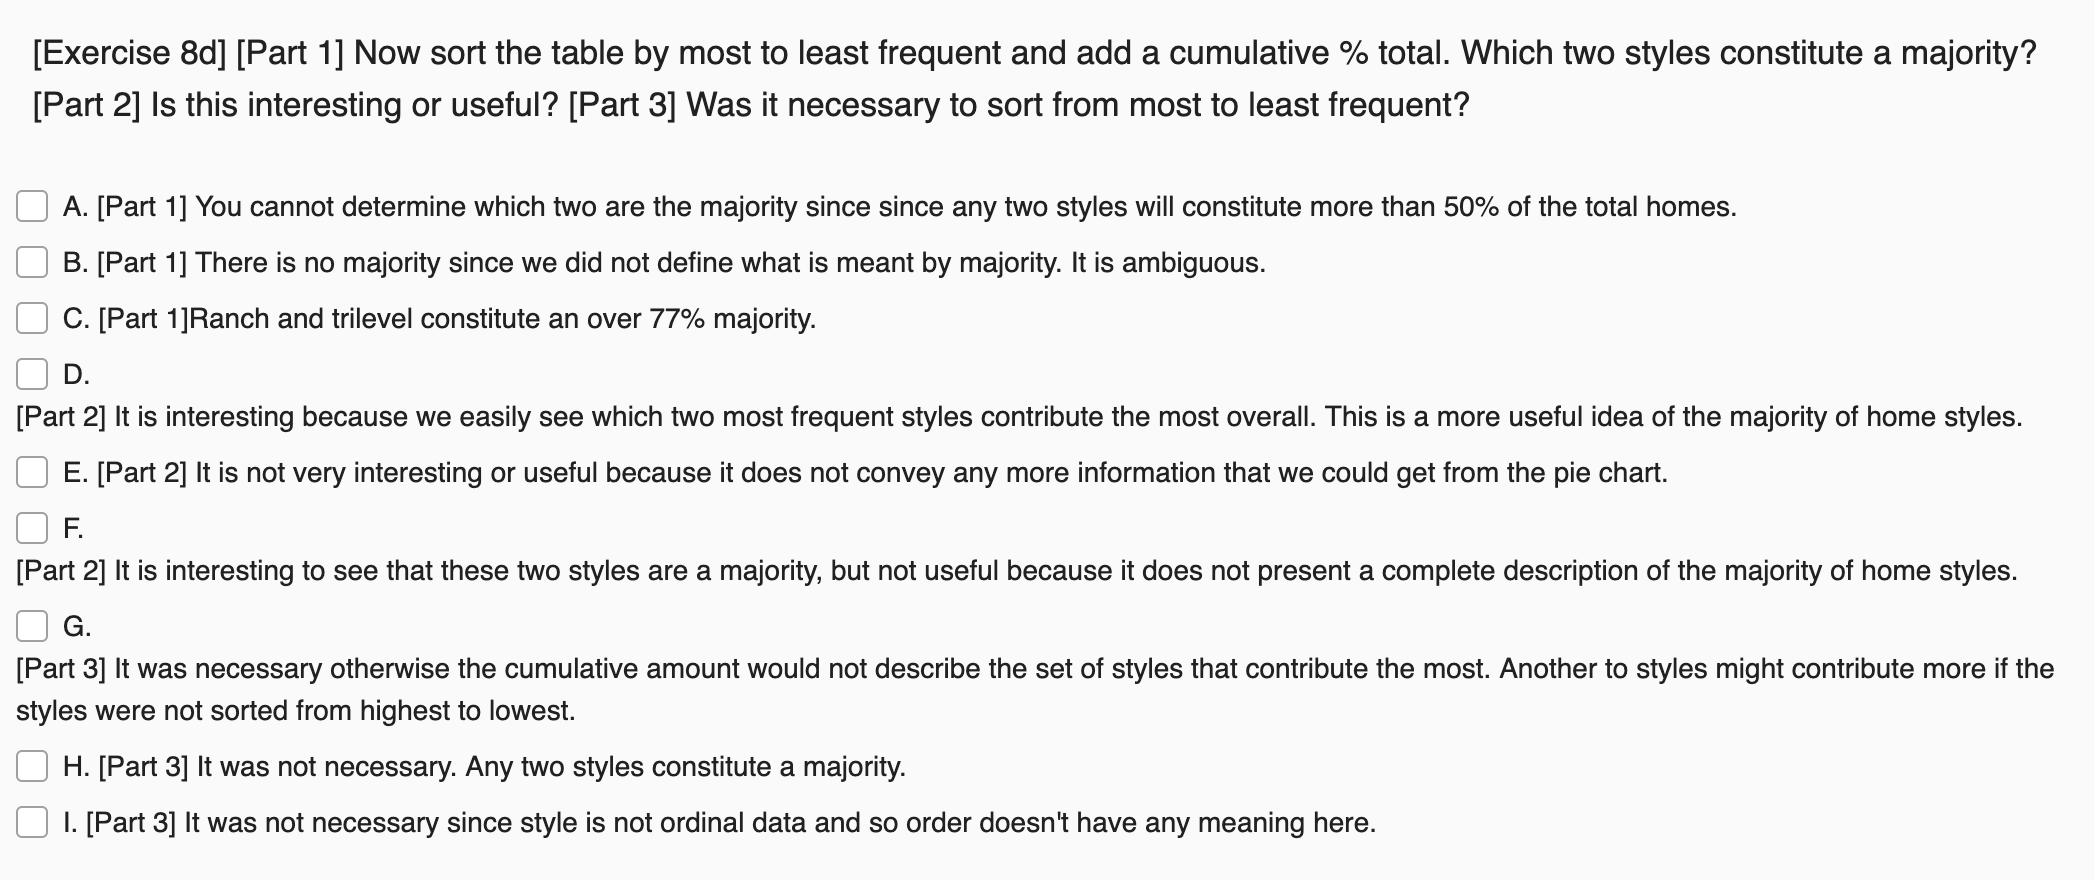
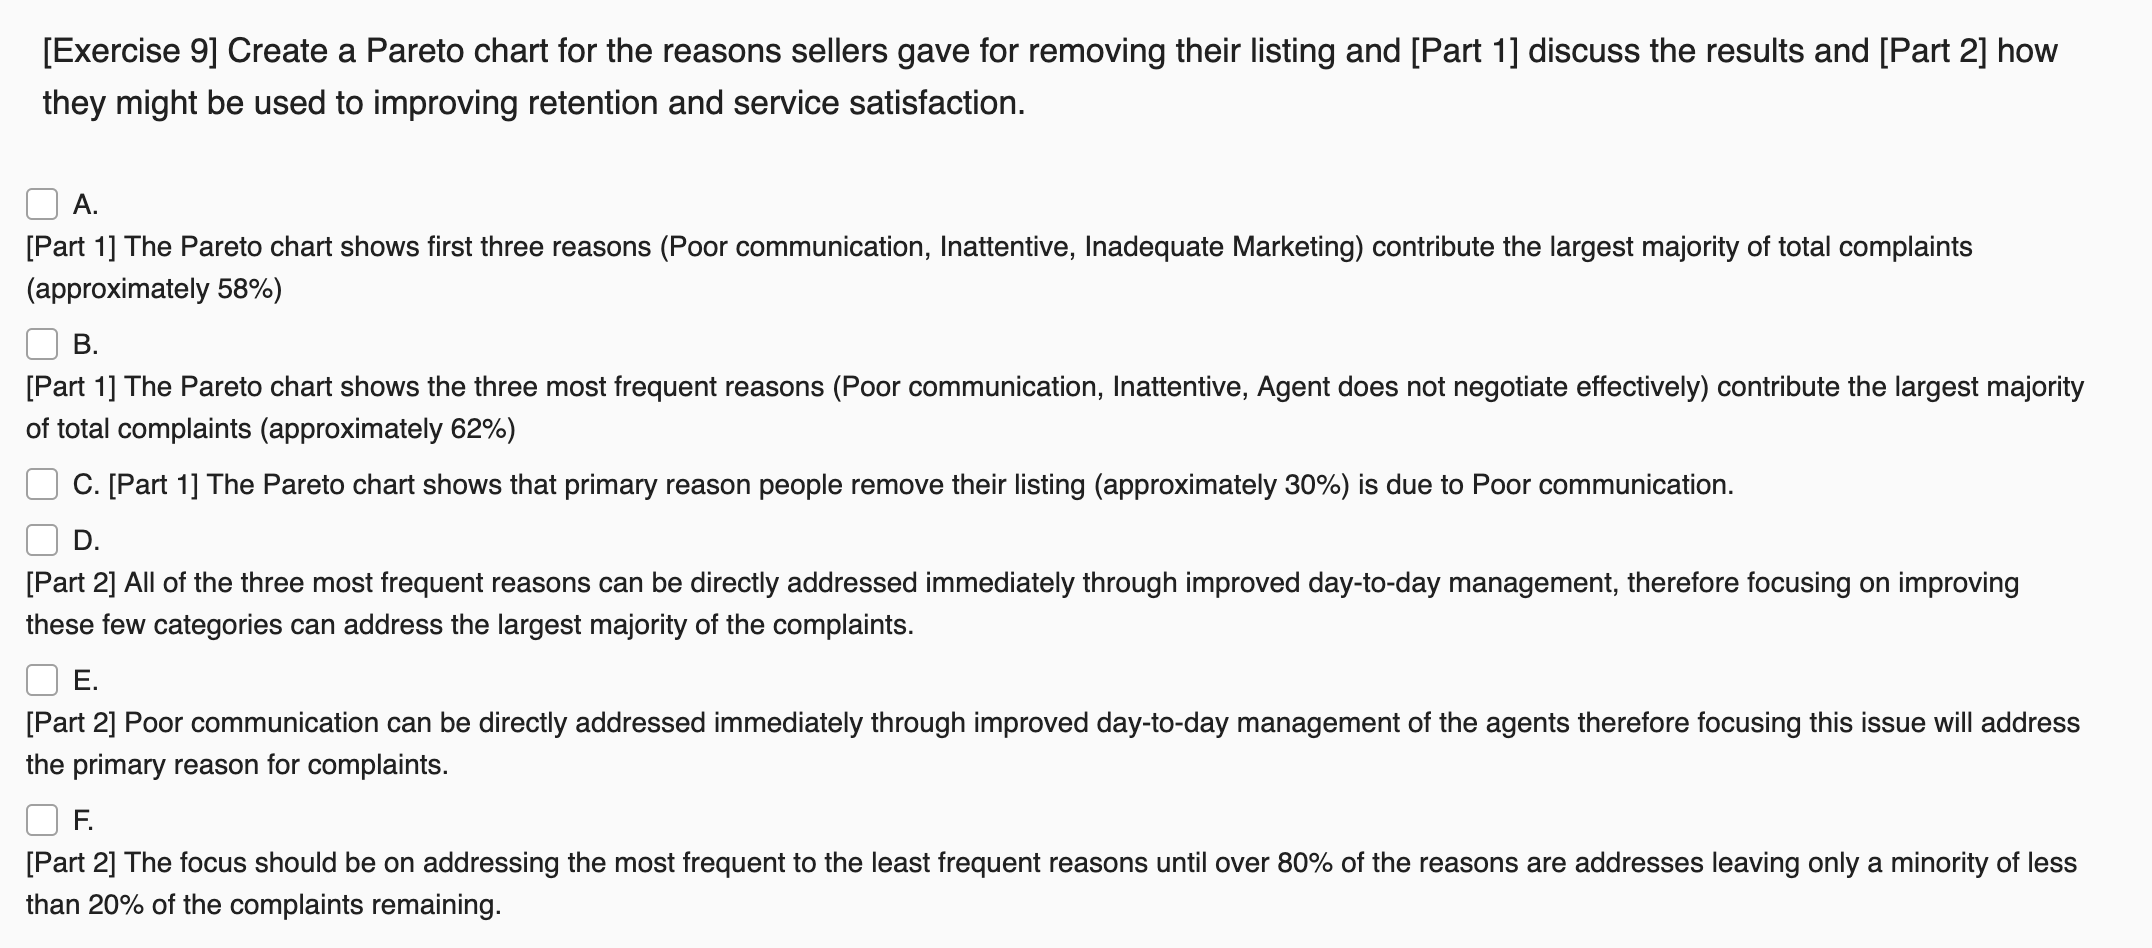
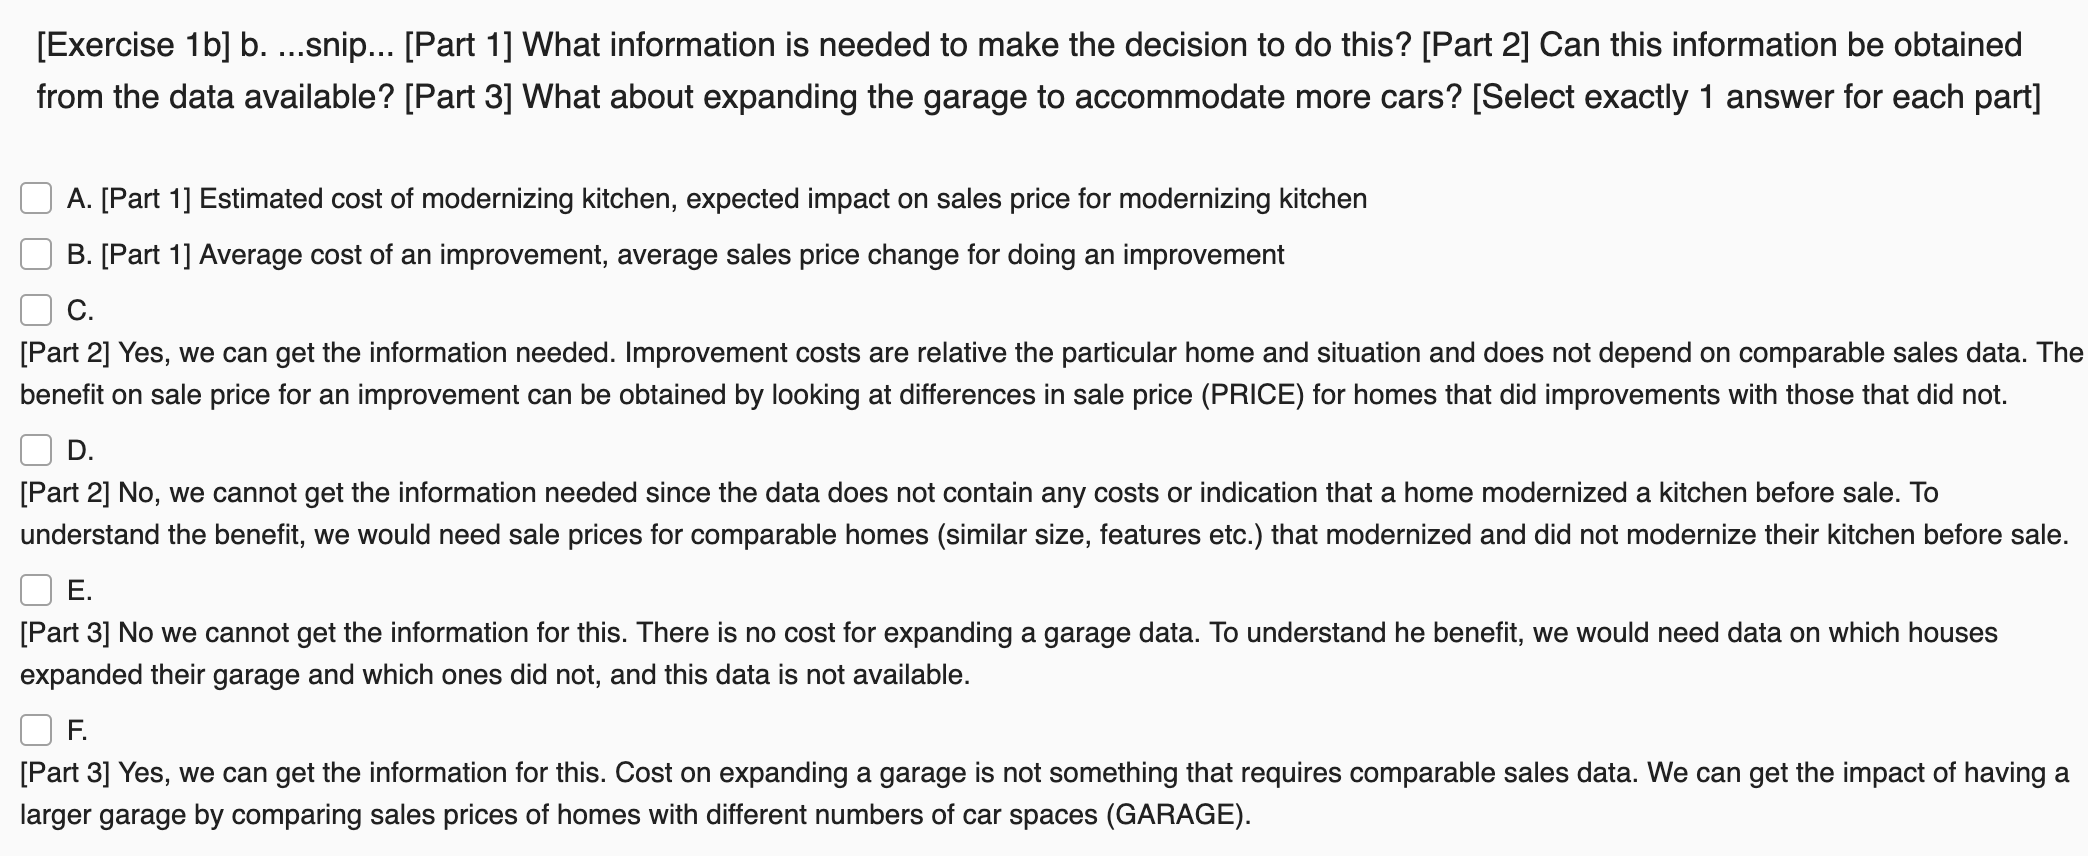
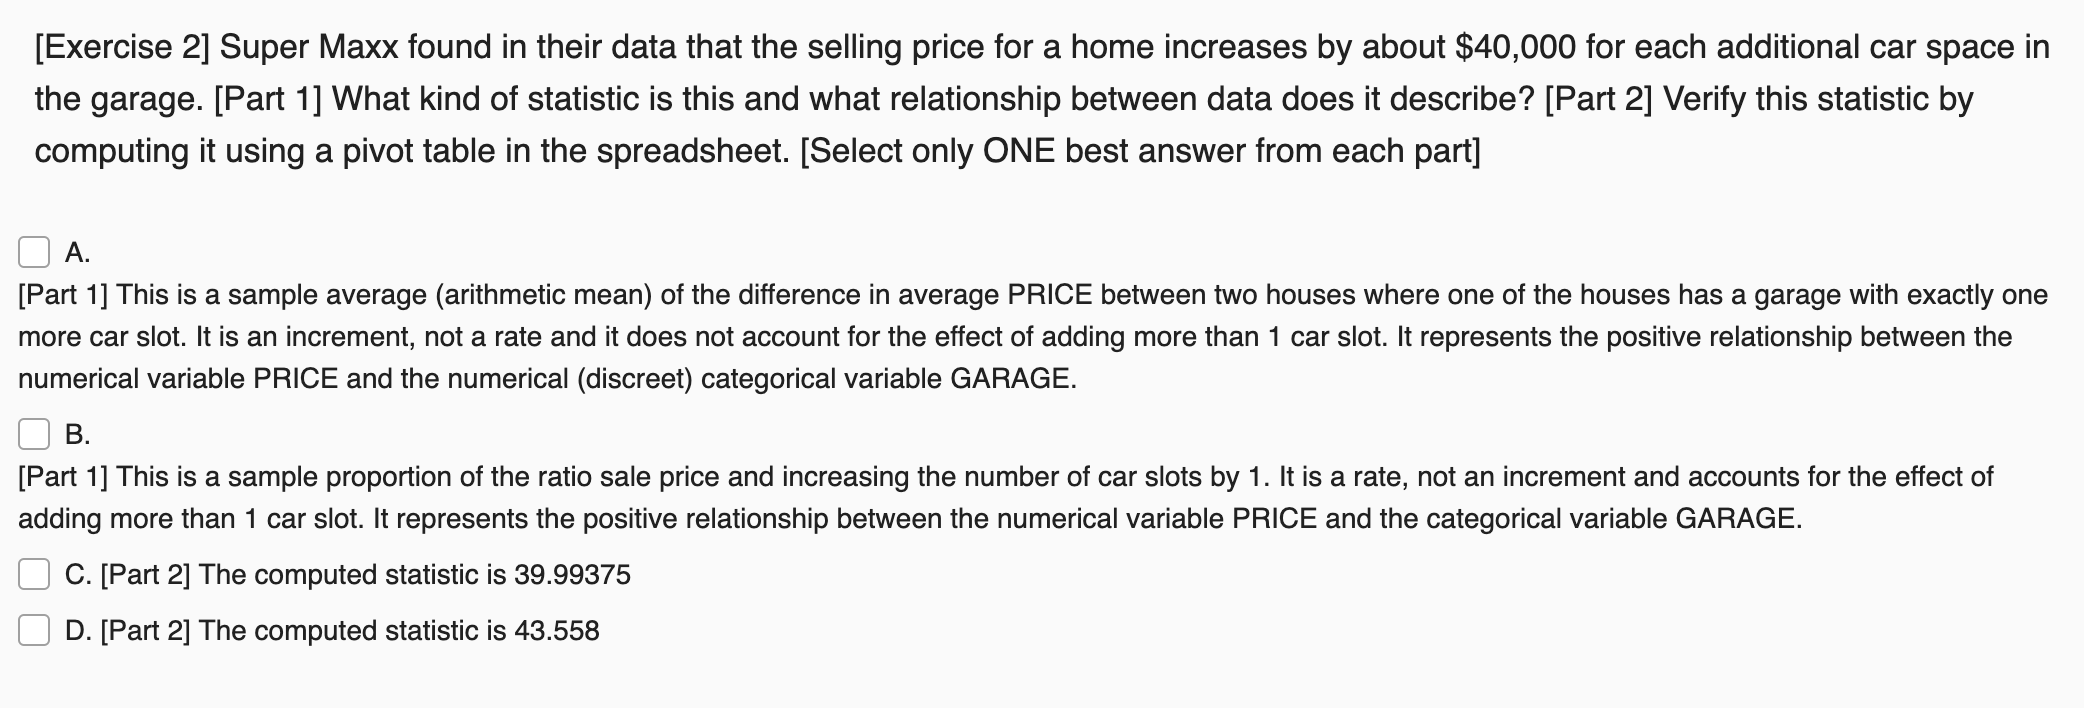
[Exercise 1a) a. For this situation, discuss why it is important to base improvement advice on reliable, objective data here rather than experience or gut instinct. [Select exactly 3 statements that best address the question] A. If the sales price increase from an improvement is greater than the cost then the advice is to invest in the improvement. There is no uncertainty in making this decision and so there no need to use experience or gut-instinct, only hard facts. B. Experience or gut instinct give the company a fundamental competitive advantage. Giving advice based on objective data enables the company to maintain this advantage. Without reliable objective data we cannot guarantee the benefit of an improvement will exceed the cost. This guarantee is necessary because the company is liable for losses for not advising clients responsibly. D. Assessments of confidence based only on experience or gut instinct are likely to be over-confident or under-confident(i.e. biased). A client could blame this bias for a bad outcome possibly hurting the reputation of the company. E. Biased assessments of confidence lead to decisions that result in bad outcomes more frequently than would be expected from chance or bad luck. This may make the company liable for losses for not advising clients responsibly. F. The decision relies on having a reliable assessment of the confidence that an improvement will increase the selling price more than the cost for the improvement. Without justifiable confidence in this the decision is arbitrary and the advice is useless. [Exercise 1b] b. ...snip... [Part 1] What information is needed to make the decision to do this? [Part 2] Can this information be obtained from the data available? [Part 3] What about expanding the garage to accommodate more cars? [Select exactly 1 answer for each part] A. [Part 1] Estimated cost of modernizing kitchen, expected impact on sales price for modernizing kitchen B. [Part 1] Average cost of an improvement, average sales price change for doing an improvement C. [Part 2] Yes, we can get the information needed. Improvement costs are relative the particular home and situation and does not depend on comparable sales data. The benefit on sale price for an improvement can be obtained by looking at differences in sale price (PRICE) for homes that did improvements with those that did not. D. [Part 2] No, we cannot get the information needed since the data does not contain any costs or indication that a home modernized a kitchen before sale. To understand the benefit, we would need sale prices for comparable homes (similar size, features etc.) that modernized and did not modernize their kitchen before sale. E. [Part 3] No we cannot get the information for this. There is no cost for expanding a garage data. To understand he benefit, we would need data on which houses expanded their garage and which ones did not, and this data is not available. F. [Part 3] Yes, we can get the information for this. Cost on expanding a garage is not something that requires comparable sales data. We can get the impact of having a larger garage by comparing sales prices of homes with different numbers of car spaces (GARAGE). [Exercise 2] Super Maxx found in their data that the selling price for a home increases by about $40,000 for each additional car space in the garage. [Part 1] What kind of statistic is this and what relationship between data does it describe? [Part 2] Verify this statistic by computing it using a pivot table in the spreadsheet. [Select only ONE best answer from each part] A. [Part 1] This is a sample average (arithmetic mean) of the difference in average PRICE between two houses where one of the houses has a garage with exactly one more car slot. It is an increment, not a rate and it does not account for the effect of adding more than 1 car slot. It represents the positive relationship between the numerical variable PRICE and the numerical (discreet) categorical variable GARAGE. B. [Part 1] This is a sample proportion of the ratio sale price and increasing the number of car slots by 1. It is a rate, not an increment and accounts for the effect of adding more than 1 car slot. It represents the positive relationship between the numerical variable PRICE and the categorical variable GARAGE. C. [Part 2] The computed statistic is 39.99375 D. [Part 2] The computed statistic is 43.558 [Exercise 3] Super Maxx also found in their data that over 75% of the homes sold were less than 14 years old. [Part 1] What variable is used and is it categorical or numerical? What kind of statistic is this and what data property does it summarize? [Part 2] Verify this statistic by computing it using precentile.exe() in the spreadsheet. [Select only ONE best answer from each part] A. [Part 1] This is the 75th percentile of AGE as a numerical variable. It summarizes the relative standing (75% are below) of a particular home age (14) relative to all other values of the data. B. [Part 1] This is the value of the categorical interval variable AGE (14) where the cumulative frequency of AGE marks a certain percentage (75%) of the way through the data when AGE is ordered from lowest to highest (are below). C. [Part 2] The computed statistic is =PERCENTILE.INC(AGE, 0.75) D. [Part 2] The computed statistic is 75% of the way through the 108 values of AGE would be the value at position 81. When ordered from lowest to highest, this value is 13 years. The value at position 82 is 14 years, thus 75% of the home ages are less than 14 years. [Question 4a] Considering that sales of homes are continually occurring, what is the most general population we can say the HOMES data is a sample of? [Select only ONE best answer] A. We cannot consider this a sample of a more general population because sales of homes vary a lot over time. We would need many repeated samples over various time ranges if we want to get a representative sample. O B. The most general population we can say this is a sample of is of homes in that area at any time. Because this is an arbitrarily chosen time range, it is unbiased and can represent any time range.O C. The most general population we can say this is a sample of is of homes in that area in the time range the data was collected. Because home sales may be seasonal we cannot assume this time range is representative of all time ranges. O [Question 4b] What would we have to assume about the data that has not been given in order to make inferences from the sample data given? [Select only ONE best answer] A. Must assume that we cannot make inferences and only use descriptive statistics. B. Must assume there is enough sample data to make accurate estimates. C. Must assume the data sampled is representative and consider it may be biased. D. Must assume the data is randomly sampled. E. Must assume the sample data is random. [Exercise 4c] How might a seller client use the selling price for a home increases by about $40,000 for each additional car space in the garage statistic for deciding to increase the size of their garage? Explain why SuperMaxx should not advise clients to use this statistic for this decision. [Select all correct statements. There are exactly 5 correct statements] O A The conclusion assumes a larger garage size is what causes an increase in selling price. We have no basis for assuming this. There are equally good or better explanations of the result that contradict this assumption. For example, larger homes tend to have larger garages, but also larger homes tend to fetch higher higher selling prices regardless of garage size. B. There is insufficient variability of garage sizes in the data to support the conclusion holds in general. C. Larger garages have nothing to do with selling price. The statistic is logically absurd. D. The impact of garage size on selling price is in error. E. We don't know if the data is unbiased and representative of the clients home. So we cannot be confident that the statistic reliably applies to this clients home (unless it was in the data set). Also each additional car spot is unclear. Is this statistic a rate of sale price increase per car slot or just an increment that applies only to adding exactly 1 car spot? OF. The conclusion is ignoring the interaction between home size and garage size that effects the selling price. OG There is no data on selling prices for homes with 0 or more than 3 car spaces. So the statistic only applies to homes with 1 or 2 car space garages since we cannot get sale price comparisons between homes with O and 1 and 3 to 4 car space garages. H. The statistic was computed by comparing selling prices for different houses with given garage sizes, not the same house with different garage sizes. Because of this, there are other variables that may effect the impact of increasing the garage size and we cannot rely on the statistic for this decision. 1. The client would consider the cost of increasing their garage by N car spots. If this is much less than N*$40,000 they would make the improvement. J. The client would consider what percent $40,000 is in terms of the value of their home. If this is larger than 20% they would make the improvement. [Exercise 4d] From the data Super Maxx found that 75% of the homes sold were less than 14 years old. They also found that the ages of top 10 most frequently are 13,9,7,12,11,17,8,6,10,19 (from most frequent to least) and these together contributed to over 75% of homes sold. What are the problems with concluding that the majority of homes for sale in this area are less than 14 years old? [Select all correct statements. There are exactly 4 correct statements] A. You can't assume homes 14 years or more are a minority. It must be more than 3 deviations from the average (an outlier) to be a minority. B. 14 years is an arbitrary cutoff. We have no reasons for using this age. C. This is a descriptive statistic of a ample of homes sold at a particular time in the past and don't know how rep entative this data is for future home sales (the population). Maybe new homes are what tended to be on the market then but not now. D. Since the top-10 most frequent ages includes homes over 14 years old, and these are over 75% of the homes sold, we cannot say that homes less than 14 years are the most frequent majority. E. We need over 95% to conclude there are a majority. We have only 75% which is not strong enough. F. The statistic is only about homes sold for ages as a numerical variable. It does not tell us about what ages of homes were sold most frequently (i.e. sells well). We cannot assume that lower age homes are sold the more frequently. The top-10 ages of homes sold contradicts this. G. What constitutes a majority is ambiguous or undefined so it's not clear what 75% means means for this. [Exercise 5] [Part 1] Is the data in standard tabular format? [Part 2] What is the benefit of using this convention? [Select only ONE best answer for each part] A. [Part 1] Mostly. It is a table where data is in columns with names and the observations are organized top-down-left-right. The legend should be on the the same page as the data. B. [Part 1] No. The HOME column is not data and is not conventional. Also, data should all be numbers. Many of the data is text and it should be coded. C. [Part 1] Yes. It a table organized top-down-left-right where variable data is in columns with variable names in the table header and observations are in rows with index labels in the first column. There is a legend detailing the variables. D. [Part 2] The benefit of using this convention is that it is a well-established easily read format making is easier to share data with others and that many add-in tools will assume the data is in this format. E. [Part 2] The benefit of using this convention is that the data is well-organized. F. [Part 2] The benefit of using this convention is that it is easily understood. [Exercise 7] The VIEW variable is not consistent with its description. [Part 1] What is the purpose of coding this data? Use a VLOOKUP() or IF() function to accurately code the values to what is described. [Part 2] Why do you not want to use find and replace or sort and copy an& paste? [Select the ONE best answer for each part] A. [Part 1] The data is categorical. By coding the data with 1,2,3 we indicate we intend it to be ordinal and we wish to preserve the understanding that one view is more valuable than another. B. [Part 1] The data is categorical but we want to use it as numerical. By coding the data with numbers it convert it to numerical so we can compute important statistics such as the average. C. [Part 1] The data is categorical but the group names are too long and inconvenient to work with. Coding these groups as 1,2,3 makes the data easier to work with. D. [Part 2] We do not want to use find and replace or sort and copy & paste because these actually change the data and we only want to code the data. E. [Part 2] Find & replace or copy & paste are repetitive and easy to make mistakes that may be difficult to find. It also does not document what was done and so it's harder to verify. It is also not reusable should we wish code up new data or to modify the data differently in the future. F. [Part 2] We want to derive a new variable, VIEWcoded, from the VIEW data and we do not want to transform the VIEW data. [Exercise 8a] [Part 1] From the frequency table which is the most frequent (mode) house style? [Part 2] Why might this be interesting? [Part 3] Was a summary table a good way to summarize the data to answer this question? (select only one answer for each part] O A. (Part 1) ranch OB. [Part 1] trilevel C. [Part 1] twostory OD. [Part 1] there is no mode E. [Part 2] The mode does not apply because this is only a sample. F. [Part 2] The mode represents the average home style for this real estate area. G. [Part 2] The mode is an indication of which style is most typical or most likely if selected arbitrarily for this sample of homes sold. OH. [Part 2] The mode is an indication of which home style is most typical or expected for all real estate areas. [Part 3] The largest group is a property of that group compared to the whole. A summary table is a good way to compare properties on one or more groups the the whole. O J. [Part 3] The largest group compared to the others is a property between those groups. A summary table is a good way to compare properties between two or more groups OK [Part 3] The largest group compared to the others is a property of that group. A summary table is a good way to emphasize a property of a particular group compared to all the others. | L. [Part 3] The largest group compared to the others is a relationship between groups. A summary table is a good way to identify relationships between groups. [Exercise 8b] [Part 1] From the Bar chart, is there any style that seems substantially less common compared to another style? [Part 2] Why might this be interesting? [Part 3] Was this a good way to summarize the data to answer this question? OA. [Part 1] twostory is the least frequent, but not by much. B. [Part 1] The groups are not greatly different from each other so we cannot say there is a least frequent style because this is only a random sample of data. OC. [Part 1] twostory is the least frequent style because it is the is smallest and there is no other group with the same frequency. D [Part 1] Twostory is the least frequent, but not greatly smaller than the next smallest group trilevel. Trilevel in turn is even more similar to ranch. While not equal, overall no style seems remarkably less common than another. E. [Part 2] The least frequent group(s) can be an indication of which styles are not typical or underrepresented in this sample of homes sold. There may not be enough data in these groups to perform meaningful comparative analysis. F. [Part 2] The least frequent groups can be indication of the data quality and integrity of this sample of homes sold. G. [Part 2] The least frequent groups tell us which styles are not common in all homes sold. OH. [Part 2] The least frequent groups can be indication of errors in the data for this sample of homes sold. OI. [Part 3] A bar chart is a good way to show properties of a particular group. J. [Part 3] A bar chart is a good way to compare properties between two or more groups. K. [Part 3] A bar chart is a good way to compare properties of one or more groups the the whole. L. [Part 3] A bar chart is a good way to identify relationships between groups. [Exercise 8c] [Part 1] From the pie chart is there a combination of twostory style with style of home that would constitute an over 50% majority? [Part 2] Why might this be interesting? [Part 3] Was this a good way to summarize the data to answer this question? OA. [Part 1] About 23% of the sampled homes are twostory which is not a majority. B. [Part 1] Two story constitutes much less than half the sampled homes. Combining either trilevel or ranch will give an over 50% of the total homes sampled and will be a majority C. [Part 1] About a quarter of the homes are two story and there are only three parts so no combination with twostory will be a majority. D. [Part 1] twoshory combined with the largest group, ranch, will constitute a majority. E. [Part 2] This is the least style, and will not constitute a majority even when combined with another job type. The data may not be representative. F. [Part 2] This is not interesting information. G. [Part 2] This is the least frequent style and will constitute a majority when combined with any style. This indicates that each style seems well-represented relative to all the samples. H. [Part 2] it useful to know what percentage a group constitutes relative to the whole. 1. [Part 3] A pie chart is a good way to show properties of a particular group. J. [Part 3] A pie chart is a good way to compare properties between two or more groups. K. [Part 3] A pie chart is a good way to compare properties on one or more groups the the whole. L. [Part 3] A pie chart is a good way to identify relationships between groups. [Exercise 8d] [Part 1] Now sort the table by most to least frequent and add a cumulative % total. Which two styles constitute a majority? [Part 2] Is this interesting or useful? [Part 3] Was it necessary to sort from most to least frequent? A. [Part 1] You cannot determine which two are the majority since since any two styles will constitute more than 50% of the total homes. B. [Part 1] There is no majority since we did not define what is meant by majority. It is ambiguous. C. [Part 1]Ranch and trilevel constitute an over 77% majority. D. [Part 2] It is interesting because we easily see which two most frequent styles contribute the most overall. This is a more useful idea of the majority of home styles. E. [Part 2] It is not very interesting or useful because it does not convey any more information that we could get from the pie chart. F. [Part 2] It is interesting to see that these two styles are a majority, but not useful because it does not present a complete description of the majority of home styles. G. [Part 3] It was necessary otherwise the cumulative amount would not describe the set of styles that contribute the most. Another to styles might contribute more if the styles were not sorted from highest to lowest. H. [Part 3] It was not necessary. Any two styles constitute a majority. 1. [Part 3] It was not necessary since style is not ordinal data and so order doesn't have any meaning here. [Exercise 9] Create a Pareto chart for the reasons sellers gave for removing their listing and [Part 1] discuss the results and [Part 2] how they might be used to improving retention and service satisfaction. A. [Part 1] The Pareto chart shows first three reasons (Poor communication, Inattentive, Inadequate Marketing) contribute the largest majority of total complaints (approximately 58%) B. [Part 1] The Pareto chart shows the three most frequent reasons (Poor communication, Inattentive, Agent does not negotiate effectively) contribute the largest majority of total complaints (approximately 62%) C. [Part 1] The Pareto chart shows that primary reason people remove their listing (approximately 30%) is due to poor communication. D. [Part 2] All of the three most frequent reasons can be directly addressed immediately through improved day-to-day management, therefore focusing on improving these few categories can address the largest majority of the complaints. E. [Part 2] Poor communication can be directly addressed immediately through improved day-to-day management of the agents therefore focusing this issue will address the primary reason for complaints. F. [Part 2] The focus should be on addressing the most frequent to the least frequent reasons until over 80% of the reasons are addresses leaving only a minority of less than 20% of the complaints remaining. [Exercise 1a) a. For this situation, discuss why it is important to base improvement advice on reliable, objective data here rather than experience or gut instinct. [Select exactly 3 statements that best address the question] A. If the sales price increase from an improvement is greater than the cost then the advice is to invest in the improvement. There is no uncertainty in making this decision and so there no need to use experience or gut-instinct, only hard facts. B. Experience or gut instinct give the company a fundamental competitive advantage. Giving advice based on objective data enables the company to maintain this advantage. Without reliable objective data we cannot guarantee the benefit of an improvement will exceed the cost. This guarantee is necessary because the company is liable for losses for not advising clients responsibly. D. Assessments of confidence based only on experience or gut instinct are likely to be over-confident or under-confident(i.e. biased). A client could blame this bias for a bad outcome possibly hurting the reputation of the company. E. Biased assessments of confidence lead to decisions that result in bad outcomes more frequently than would be expected from chance or bad luck. This may make the company liable for losses for not advising clients responsibly. F. The decision relies on having a reliable assessment of the confidence that an improvement will increase the selling price more than the cost for the improvement. Without justifiable confidence in this the decision is arbitrary and the advice is useless. [Exercise 1b] b. ...snip... [Part 1] What information is needed to make the decision to do this? [Part 2] Can this information be obtained from the data available? [Part 3] What about expanding the garage to accommodate more cars? [Select exactly 1 answer for each part] A. [Part 1] Estimated cost of modernizing kitchen, expected impact on sales price for modernizing kitchen B. [Part 1] Average cost of an improvement, average sales price change for doing an improvement C. [Part 2] Yes, we can get the information needed. Improvement costs are relative the particular home and situation and does not depend on comparable sales data. The benefit on sale price for an improvement can be obtained by looking at differences in sale price (PRICE) for homes that did improvements with those that did not. D. [Part 2] No, we cannot get the information needed since the data does not contain any costs or indication that a home modernized a kitchen before sale. To understand the benefit, we would need sale prices for comparable homes (similar size, features etc.) that modernized and did not modernize their kitchen before sale. E. [Part 3] No we cannot get the information for this. There is no cost for expanding a garage data. To understand he benefit, we would need data on which houses expanded their garage and which ones did not, and this data is not available. F. [Part 3] Yes, we can get the information for this. Cost on expanding a garage is not something that requires comparable sales data. We can get the impact of having a larger garage by comparing sales prices of homes with different numbers of car spaces (GARAGE). [Exercise 2] Super Maxx found in their data that the selling price for a home increases by about $40,000 for each additional car space in the garage. [Part 1] What kind of statistic is this and what relationship between data does it describe? [Part 2] Verify this statistic by computing it using a pivot table in the spreadsheet. [Select only ONE best answer from each part] A. [Part 1] This is a sample average (arithmetic mean) of the difference in average PRICE between two houses where one of the houses has a garage with exactly one more car slot. It is an increment, not a rate and it does not account for the effect of adding more than 1 car slot. It represents the positive relationship between the numerical variable PRICE and the numerical (discreet) categorical variable GARAGE. B. [Part 1] This is a sample proportion of the ratio sale price and increasing the number of car slots by 1. It is a rate, not an increment and accounts for the effect of adding more than 1 car slot. It represents the positive relationship between the numerical variable PRICE and the categorical variable GARAGE. C. [Part 2] The computed statistic is 39.99375 D. [Part 2] The computed statistic is 43.558 [Exercise 3] Super Maxx also found in their data that over 75% of the homes sold were less than 14 years old. [Part 1] What variable is used and is it categorical or numerical? What kind of statistic is this and what data property does it summarize? [Part 2] Verify this statistic by computing it using precentile.exe() in the spreadsheet. [Select only ONE best answer from each part] A. [Part 1] This is the 75th percentile of AGE as a numerical variable. It summarizes the relative standing (75% are below) of a particular home age (14) relative to all other values of the data. B. [Part 1] This is the value of the categorical interval variable AGE (14) where the cumulative frequency of AGE marks a certain percentage (75%) of the way through the data when AGE is ordered from lowest to highest (are below). C. [Part 2] The computed statistic is =PERCENTILE.INC(AGE, 0.75) D. [Part 2] The computed statistic is 75% of the way through the 108 values of AGE would be the value at position 81. When ordered from lowest to highest, this value is 13 years. The value at position 82 is 14 years, thus 75% of the home ages are less than 14 years. [Question 4a] Considering that sales of homes are continually occurring, what is the most general population we can say the HOMES data is a sample of? [Select only ONE best answer] A. We cannot consider this a sample of a more general population because sales of homes vary a lot over time. We would need many repeated samples over various time ranges if we want to get a representative sample. O B. The most general population we can say this is a sample of is of homes in that area at any time. Because this is an arbitrarily chosen time range, it is unbiased and can represent any time range.O C. The most general population we can say this is a sample of is of homes in that area in the time range the data was collected. Because home sales may be seasonal we cannot assume this time range is representative of all time ranges. O [Question 4b] What would we have to assume about the data that has not been given in order to make inferences from the sample data given? [Select only ONE best answer] A. Must assume that we cannot make inferences and only use descriptive statistics. B. Must assume there is enough sample data to make accurate estimates. C. Must assume the data sampled is representative and consider it may be biased. D. Must assume the data is randomly sampled. E. Must assume the sample data is random. [Exercise 4c] How might a seller client use the selling price for a home increases by about $40,000 for each additional car space in the garage statistic for deciding to increase the size of their garage? Explain why SuperMaxx should not advise clients to use this statistic for this decision. [Select all correct statements. There are exactly 5 correct statements] O A The conclusion assumes a larger garage size is what causes an increase in selling price. We have no basis for assuming this. There are equally good or better explanations of the result that contradict this assumption. For example, larger homes tend to have larger garages, but also larger homes tend to fetch higher higher selling prices regardless of garage size. B. There is insufficient variability of garage sizes in the data to support the conclusion holds in general. C. Larger garages have nothing to do with selling price. The statistic is logically absurd. D. The impact of garage size on selling price is in error. E. We don't know if the data is unbiased and representative of the clients home. So we cannot be confident that the statistic reliably applies to this clients home (unless it was in the data set). Also each additional car spot is unclear. Is this statistic a rate of sale price increase per car slot or just an increment that applies only to adding exactly 1 car spot? OF. The conclusion is ignoring the interaction between home size and garage size that effects the selling price. OG There is no data on selling prices for homes with 0 or more than 3 car spaces. So the statistic only applies to homes with 1 or 2 car space garages since we cannot get sale price comparisons between homes with O and 1 and 3 to 4 car space garages. H. The statistic was computed by comparing selling prices for different houses with given garage sizes, not the same house with different garage sizes. Because of this, there are other variables that may effect the impact of increasing the garage size and we cannot rely on the statistic for this decision. 1. The client would consider the cost of increasing their garage by N car spots. If this is much less than N*$40,000 they would make the improvement. J. The client would consider what percent $40,000 is in terms of the value of their home. If this is larger than 20% they would make the improvement. [Exercise 4d] From the data Super Maxx found that 75% of the homes sold were less than 14 years old. They also found that the ages of top 10 most frequently are 13,9,7,12,11,17,8,6,10,19 (from most frequent to least) and these together contributed to over 75% of homes sold. What are the problems with concluding that the majority of homes for sale in this area are less than 14 years old? [Select all correct statements. There are exactly 4 correct statements] A. You can't assume homes 14 years or more are a minority. It must be more than 3 deviations from the average (an outlier) to be a minority. B. 14 years is an arbitrary cutoff. We have no reasons for using this age. C. This is a descriptive statistic of a ample of homes sold at a particular time in the past and don't know how rep entative this data is for future home sales (the population). Maybe new homes are what tended to be on the market then but not now. D. Since the top-10 most frequent ages includes homes over 14 years old, and these are over 75% of the homes sold, we cannot say that homes less than 14 years are the most frequent majority. E. We need over 95% to conclude there are a majority. We have only 75% which is not strong enough. F. The statistic is only about homes sold for ages as a numerical variable. It does not tell us about what ages of homes were sold most frequently (i.e. sells well). We cannot assume that lower age homes are sold the more frequently. The top-10 ages of homes sold contradicts this. G. What constitutes a majority is ambiguous or undefined so it's not clear what 75% means means for this. [Exercise 5] [Part 1] Is the data in standard tabular format? [Part 2] What is the benefit of using this convention? [Select only ONE best answer for each part] A. [Part 1] Mostly. It is a table where data is in columns with names and the observations are organized top-down-left-right. The legend should be on the the same page as the data. B. [Part 1] No. The HOME column is not data and is not conventional. Also, data should all be numbers. Many of the data is text and it should be coded. C. [Part 1] Yes. It a table organized top-down-left-right where variable data is in columns with variable names in the table header and observations are in rows with index labels in the first column. There is a legend detailing the variables. D. [Part 2] The benefit of using this convention is that it is a well-established easily read format making is easier to share data with others and that many add-in tools will assume the data is in this format. E. [Part 2] The benefit of using this convention is that the data is well-organized. F. [Part 2] The benefit of using this convention is that it is easily understood. [Exercise 7] The VIEW variable is not consistent with its description. [Part 1] What is the purpose of coding this data? Use a VLOOKUP() or IF() function to accurately code the values to what is described. [Part 2] Why do you not want to use find and replace or sort and copy an& paste? [Select the ONE best answer for each part] A. [Part 1] The data is categorical. By coding the data with 1,2,3 we indicate we intend it to be ordinal and we wish to preserve the understanding that one view is more valuable than another. B. [Part 1] The data is categorical but we want to use it as numerical. By coding the data with numbers it convert it to numerical so we can compute important statistics such as the average. C. [Part 1] The data is categorical but the group names are too long and inconvenient to work with. Coding these groups as 1,2,3 makes the data easier to work with. D. [Part 2] We do not want to use find and replace or sort and copy & paste because these actually change the data and we only want to code the data. E. [Part 2] Find & replace or copy & paste are repetitive and easy to make mistakes that may be difficult to find. It also does not document what was done and so it's harder to verify. It is also not reusable should we wish code up new data or to modify the data differently in the future. F. [Part 2] We want to derive a new variable, VIEWcoded, from the VIEW data and we do not want to transform the VIEW data. [Exercise 8a] [Part 1] From the frequency table which is the most frequent (mode) house style? [Part 2] Why might this be interesting? [Part 3] Was a summary table a good way to summarize the data to answer this question? (select only one answer for each part] O A. (Part 1) ranch OB. [Part 1] trilevel C. [Part 1] twostory OD. [Part 1] there is no mode E. [Part 2] The mode does not apply because this is only a sample. F. [Part 2] The mode represents the average home style for this real estate area. G. [Part 2] The mode is an indication of which style is most typical or most likely if selected arbitrarily for this sample of homes sold. OH. [Part 2] The mode is an indication of which home style is most typical or expected for all real estate areas. [Part 3] The largest group is a property of that group compared to the whole. A summary table is a good way to compare properties on one or more groups the the whole. O J. [Part 3] The largest group compared to the others is a property between those groups. A summary table is a good way to compare properties between two or more groups OK [Part 3] The largest group compared to the others is a property of that group. A summary table is a good way to emphasize a property of a particular group compared to all the others. | L. [Part 3] The largest group compared to the others is a relationship between groups. A summary table is a good way to identify relationships between groups. [Exercise 8b] [Part 1] From the Bar chart, is there any style that seems substantially less common compared to another style? [Part 2] Why might this be interesting? [Part 3] Was this a good way to summarize the data to answer this question? OA. [Part 1] twostory is the least frequent, but not by much. B. [Part 1] The groups are not greatly different from each other so we cannot say there is a least frequent style because this is only a random sample of data. OC. [Part 1] twostory is the least frequent style because it is the is smallest and there is no other group with the same frequency. D [Part 1] Twostory is the least frequent, but not greatly smaller than the next smallest group trilevel. Trilevel in turn is even more similar to ranch. While not equal, overall no style seems remarkably less common than another. E. [Part 2] The least frequent group(s) can be an indication of which styles are not typical or underrepresented in this sample of homes sold. There may not be enough data in these groups to perform meaningful comparative analysis. F. [Part 2] The least frequent groups can be indication of the data quality and integrity of this sample of homes sold. G. [Part 2] The least frequent groups tell us which styles are not common in all homes sold. OH. [Part 2] The least frequent groups can be indication of errors in the data for this sample of homes sold. OI. [Part 3] A bar chart is a good way to show properties of a particular group. J. [Part 3] A bar chart is a good way to compare properties between two or more groups. K. [Part 3] A bar chart is a good way to compare properties of one or more groups the the whole. L. [Part 3] A bar chart is a good way to identify relationships between groups. [Exercise 8c] [Part 1] From the pie chart is there a combination of twostory style with style of home that would constitute an over 50% majority? [Part 2] Why might this be interesting? [Part 3] Was this a good way to summarize the data to answer this question? OA. [Part 1] About 23% of the sampled homes are twostory which is not a majority. B. [Part 1] Two story constitutes much less than half the sampled homes. Combining either trilevel or ranch will give an over 50% of the total homes sampled and will be a majority C. [Part 1] About a quarter of the homes are two story and there are only three parts so no combination with twostory will be a majority. D. [Part 1] twoshory combined with the largest group, ranch, will constitute a majority. E. [Part 2] This is the least style, and will not constitute a majority even when combined with another job type. The data may not be representative. F. [Part 2] This is not interesting information. G. [Part 2] This is the least frequent style and will constitute a majority when combined with any style. This indicates that each style seems well-represented relative to all the samples. H. [Part 2] it useful to know what percentage a group constitutes relative to the whole. 1. [Part 3] A pie chart is a good way to show properties of a particular group. J. [Part 3] A pie chart is a good way to compare properties between two or more groups. K. [Part 3] A pie chart is a good way to compare properties on one or more groups the the whole. L. [Part 3] A pie chart is a good way to identify relationships between groups. [Exercise 8d] [Part 1] Now sort the table by most to least frequent and add a cumulative % total. Which two styles constitute a majority? [Part 2] Is this interesting or useful? [Part 3] Was it necessary to sort from most to least frequent? A. [Part 1] You cannot determine which two are the majority since since any two styles will constitute more than 50% of the total homes. B. [Part 1] There is no majority since we did not define what is meant by majority. It is ambiguous. C. [Part 1]Ranch and trilevel constitute an over 77% majority. D. [Part 2] It is interesting because we easily see which two most frequent styles contribute the most overall. This is a more useful idea of the majority of home styles. E. [Part 2] It is not very interesting or useful because it does not convey any more information that we could get from the pie chart. F. [Part 2] It is interesting to see that these two styles are a majority, but not useful because it does not present a complete description of the majority of home styles. G. [Part 3] It was necessary otherwise the cumulative amount would not describe the set of styles that contribute the most. Another to styles might contribute more if the styles were not sorted from highest to lowest. H. [Part 3] It was not necessary. Any two styles constitute a majority. 1. [Part 3] It was not necessary since style is not ordinal data and so order doesn't have any meaning here. [Exercise 9] Create a Pareto chart for the reasons sellers gave for removing their listing and [Part 1] discuss the results and [Part 2] how they might be used to improving retention and service satisfaction. A. [Part 1] The Pareto chart shows first three reasons (Poor communication, Inattentive, Inadequate Marketing) contribute the largest majority of total complaints (approximately 58%) B. [Part 1] The Pareto chart shows the three most frequent reasons (Poor communication, Inattentive, Agent does not negotiate effectively) contribute the largest majority of total complaints (approximately 62%) C. [Part 1] The Pareto chart shows that primary reason people remove their listing (approximately 30%) is due to poor communication. D. [Part 2] All of the three most frequent reasons can be directly addressed immediately through improved day-to-day management, therefore focusing on improving these few categories can address the largest majority of the complaints. E. [Part 2] Poor communication can be directly addressed immediately through improved day-to-day management of the agents therefore focusing this issue will address the primary reason for complaints. F. [Part 2] The focus should be on addressing the most frequent to the least frequent reasons until over 80% of the reasons are addresses leaving only a minority of less than 20% of the complaints remaining
Step by Step Solution
There are 3 Steps involved in it

Get step-by-step solutions from verified subject matter experts


