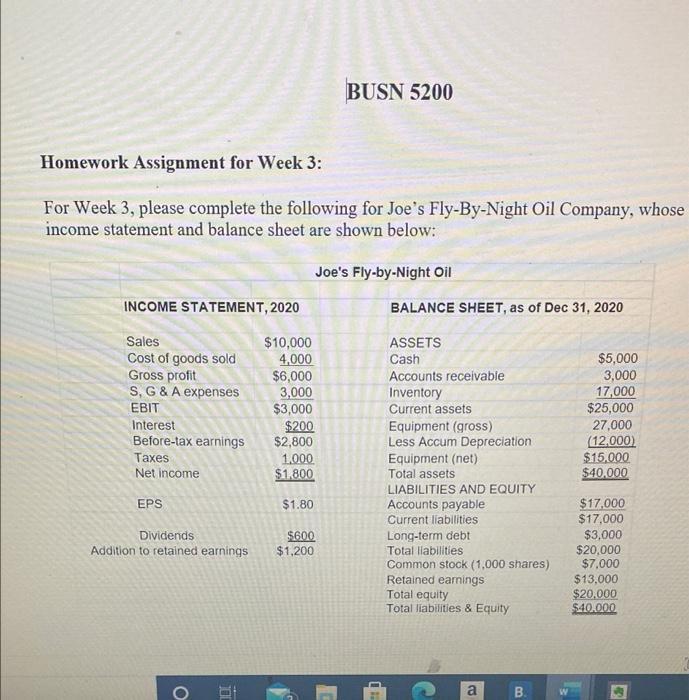
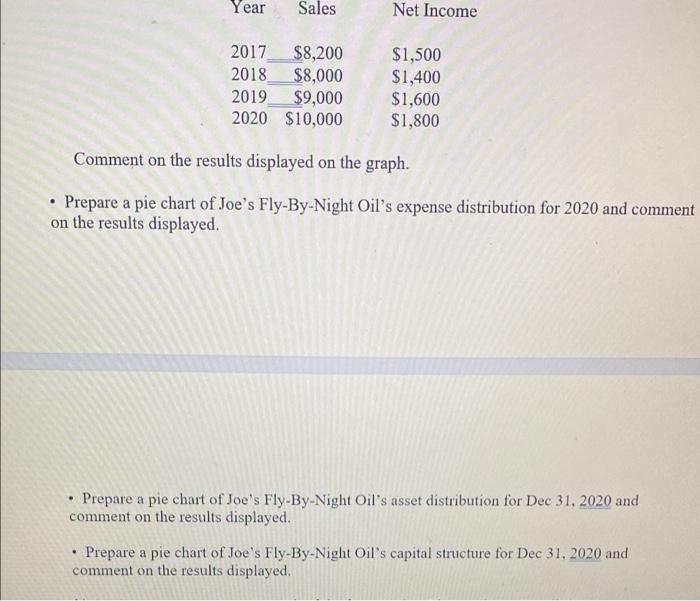
BUSN 5200 Homework Assignment for Week 3: For Week 3, please complete the following for Joe's Fly-By-Night Oil Company, whose income statement and balance sheet are shown below: Joe's Fly-by-Night Oil INCOME STATEMENT, 2020 BALANCE SHEET, as of Dec 31, 2020 Sales Cost of goods sold Gross profit S, G & A expenses EBIT Interest Before-tax earnings Taxes Net income $10,000 4,000 $6,000 3,000 $3,000 $200 $2,800 1.000 $1.800 ASSETS Cash Accounts receivable Inventory Current assets Equipment (gross) Less Accum Depreciation Equipment (net) Total assets LIABILITIES AND EQUITY Accounts payable Current liabilities Long-term debt Total liabilities Common stock (1,000 shares) Retained eamings Total equity Total liabilities & Equity $5,000 3,000 17,000 $25,000 27,000 (12.000) $15.000 $40.000 EPS $1.80 Dividends Addition to retained earnings $600 $1,200 $17,000 $17,000 $3,000 $20,000 $7,000 $13,000 $20,000 $40.000 o a a B ww Year Sales Net Income 2017 $8,200 2018 $8,000 2019 $9,000 2020 $10,000 $1,500 $1,400 $1,600 $1,800 Comment on the results displayed on the graph. Prepare a pie chart of Joe's Fly-By-Night Oil's expense distribution for 2020 and comment on the results displayed. . Prepare a pie chart of Joe's Fly-By-Night Oil's asset distribution for Dec 31, 2020 and comment on the results displayed. . Prepare a pie chart of Joe's Fly-By-Night Oil's capital structure for Dec 31, 2020 and comment on the results displayed. BUSN 5200 Homework Assignment for Week 3: For Week 3, please complete the following for Joe's Fly-By-Night Oil Company, whose income statement and balance sheet are shown below: Joe's Fly-by-Night Oil INCOME STATEMENT, 2020 BALANCE SHEET, as of Dec 31, 2020 Sales Cost of goods sold Gross profit S, G & A expenses EBIT Interest Before-tax earnings Taxes Net income $10,000 4,000 $6,000 3,000 $3,000 $200 $2,800 1.000 $1.800 ASSETS Cash Accounts receivable Inventory Current assets Equipment (gross) Less Accum Depreciation Equipment (net) Total assets LIABILITIES AND EQUITY Accounts payable Current liabilities Long-term debt Total liabilities Common stock (1,000 shares) Retained eamings Total equity Total liabilities & Equity $5,000 3,000 17,000 $25,000 27,000 (12.000) $15.000 $40.000 EPS $1.80 Dividends Addition to retained earnings $600 $1,200 $17,000 $17,000 $3,000 $20,000 $7,000 $13,000 $20,000 $40.000 o a a B ww Year Sales Net Income 2017 $8,200 2018 $8,000 2019 $9,000 2020 $10,000 $1,500 $1,400 $1,600 $1,800 Comment on the results displayed on the graph. Prepare a pie chart of Joe's Fly-By-Night Oil's expense distribution for 2020 and comment on the results displayed. . Prepare a pie chart of Joe's Fly-By-Night Oil's asset distribution for Dec 31, 2020 and comment on the results displayed. . Prepare a pie chart of Joe's Fly-By-Night Oil's capital structure for Dec 31, 2020 and comment on the results displayed