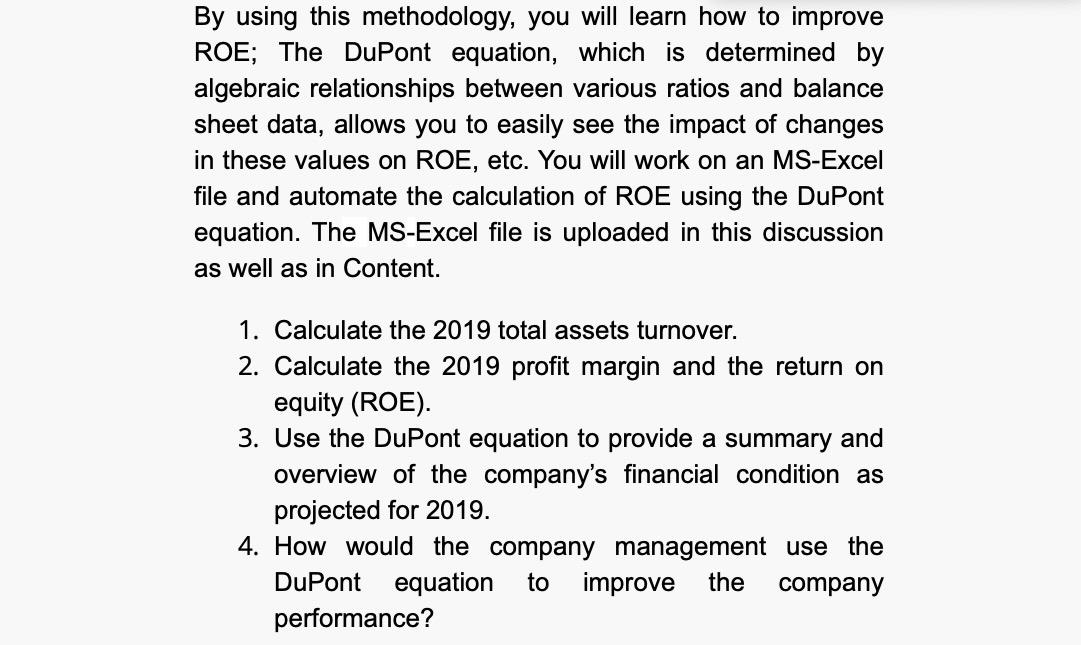
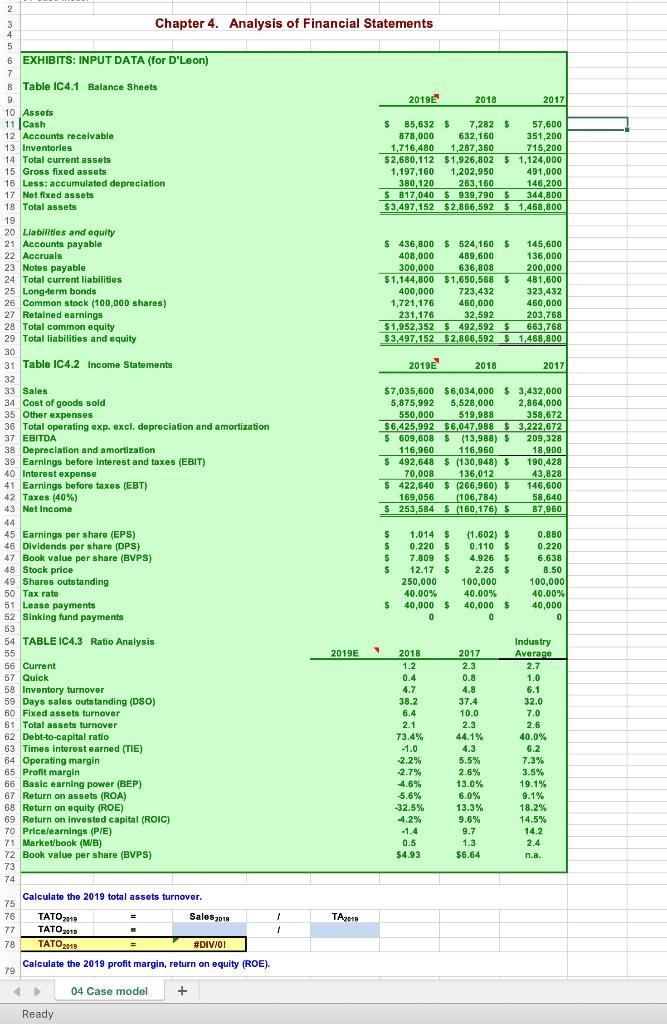
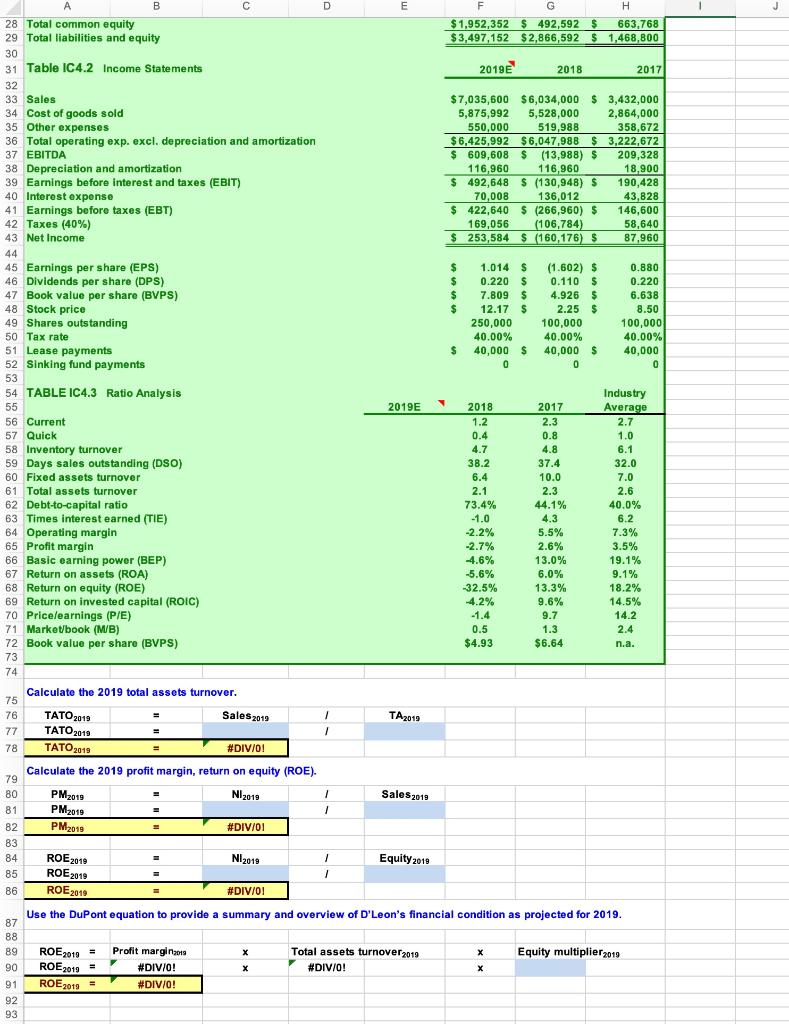
By using this methodology, you will learn how to improve ROE; The DuPont equation, which is determined by algebraic relationships between various ratios and balance sheet data, allows you to easily see the impact of changes in these values on ROE, etc. You will work on an MS-Excel file and automate the calculation of ROE using the DuPont equation. The MS-Excel file is uploaded in this discussion as well as in Content. 1. Calculate the 2019 total assets turnover. 2. Calculate the 2019 profit margin and the return on equity (ROE). 3. Use the DuPont equation to provide a summary and overview of the company's financial condition as projected for 2019. 4. How would the company management use the DuPont equation to improve the company performance? 2 Chapter 4. Analysis of Financial Statements 4 5 6 EXHIBITS: INPUT DATA (for D'Leon) 7 8 Table IC4.1 Balance Sheets 9 2019E 2018 2017 10 Assets 11 Cash $ 85,632 $ 7,282 $ 57,600 12 Accounts receivable 878,000 632,160 351,200 13 Inventories 1,716,480 1,287,360 715,200 14 Total current assets $ 2,680,112 $1,926,802 $ 1,124,000 15 Gross fixed assets 1,197,160 1,202,950 491,000 16 Less: accumulated depreciation 380,120 263,160 146,200 17 Net fixed assets $ 817,040 $ 939,790 $ 344,800 18 Total assets $3,497,152 $2,866,592 $ 1,468,800 19 20 Liabilities and equity 21 Accounts payable $ 436,800 $ 524,160 $ 145,600 22 Accruals 408,000 489,600 136,000 23 Notes payable 300,000 636,808 200,000 24 Total current liabilities $1,144,800 $1,650,568 $ 481,600 25 Long-term bonds 400,000 723,432 323,432 26 Common stock (100,000 shares) 1,721,176 450,000 460,000 27 Retained earnings 231,176 32,592 203,768 28 Total common equity $1,952,352 $ 492,592 $ 663,768 29 Total liabilities and equity $3,497,152 $2,866,592 $ 1,468,800 30 31 Table IC4.2 Income Statements 2019 2018 2017 32 33 Sales $7,035,600 $6,034,000 $3,432,000 34 Cost of goods sold 5,875,992 5,528,000 2,864,000 35 Other expenses 550,000 519,988 358,672 36 Total operating exp. excl. depreciation and amortization . . $6,425,992 $6,047,988 $ 3,222,672 37 EBITDA $ 609,808 $ (13,988) $ 209,328 38 Depreciation and amortization 116,960 116,950 18,900 39 Earnings before Interest and taxes (EBIT) $ 492,648 $ (130,948) $ 190,428 40 Interest expense 70,008 136,012 43,828 41 Earnings before taxes (EBT) $ 422,640 $ (266,960) $ 146,600 42 Taxes (40%) 169,056 (106,784) 58,640 43 Net Income $ 253,584 $ (160,176) $ 87,960 44 45 Earnings per share (EPS) $ 1.014 $ (1.602) $ 0.880 46 Dividends per share (DPS) $ 0.220 S 0.110 $ 0.220 47 Book value per share (BVPS) 5 7.809 $ 4.926 $ 6.638 48 Stock price $ 12.17 $ 2.25 $ 8.50 49 Shares outstanding 250,000 100,000 100,000 50 Tax rate 40.00% 40.00% 40.00% 51 Lease payments $ s 40,000 $ 40,000 $ 40,000 52 Sinking fund payments 0 0 0 53 54 TABLE IC4.3 Ratio Analysis Industry 55 2019E 2018 2017 56 Current 1.2 2.3 2.7 57 Quick 0.4 0.8 1.0 58 Inventory turnover 4.7 4.8 6.1 59 Days sales outstanding (DSO) 38.2 37.4 32.0 60 Fixed assets turnover 6.4 10.0 7.0 61 Total assets turnover 2.1 2.3 2.6 62 Debt-to-capital ratio 73.4% 44.1% 40.0% 63 Times interest earned (TIE) -1.0 4.3 6.2 64 Operating margin -2.2% 5.5% 7.3% 65 Profit margin -2.7% 2.6% 3.5% 66 Basic earning power (BEP) 4.6% 13.0% 19.1% 67 Return on assets (ROA) 5.6% 6.0% 9.1% 68 Return on oquity (ROE) -32.5% 13.3% 18.2% 69 Return on invested capital (ROIC) 4.2% 9.6% 14.5% 70 Price/earnings (P/E) -1.4 9.7 14.2 71 Market/book (MB) 0.5 1.3 2.4 72 Book value per share (BVPS) $4.93 $6.64 n.a. 73 74 Calculate the 2019 total assets turnover. 75 76 TATO Sales 2018 1 TA2010 77 TATO2019 1 78 TATO 2010 Calculate the 2019 profit margin, return on equity (ROE). 79 Average #DIV/OI 04 Case model + Ready D E J F G H $1,952,352 $ 492,592 $ 663,768 $3,497,152 $2,866,592 $ 1,468,800 2019E 2018 2017 $7,035,600 $6,034,000 $ 3,432,000 5,875,992 5,528,000 2,864,000 550,000 519,988 358,672 $6,425,992 $6,047,988 $ 3,222,672 $ 609,608 $ (13,988) $ 209,328 116,960 116,960 18,900 $ 492,648 $ (130,948) $ 190,428 70,008 136,012 43,828 $ 422,640 $ (266,960) $ 146,600 169,056 (106,784) 58,640 $ 253,584 $ (160,176) $ 87,960 $ $ $ $ A B 28 Total common equity 29 Total liabilities and equity 30 31 Table IC4.2 Income Statements 32 33 Sales 34 Cost of goods sold 35 Other expenses 36 Total operating exp. excl. depreciation and amortization 37 EBITDA 38 Depreciation and amortization 39 Earnings before interest and taxes (EBIT) 40 Interest expense 41 Earnings before taxes (EBT) 42 Taxes (40%) 43 Net Income 44 45 Earnings per share (EPS) 46 Dividends per share (DPS) 47 Book value per share (BVPS) 48 Stock price 49 Shares outstanding 50 Tax rate 51 Lease payments 52 Sinking fund payments 53 54 TABLE IC4.3 Ratio Analysis 55 56 Current 57 Quick 58 Inventory turnover 59 Days sales outstanding (DSO) 60 Fixed assets turnover 61 Total assets turnover 62 Debt-to-capital ratio 63 Times interest earned (TIE) 64 Operating margin 65 Profit margin 66 Basic earning power (BEP) 67 Return on assets (ROA) 68 Return on equity (ROE) 69 Return on invested capital (ROIC) 70 Price/earnings (P/E) 71 Market/book (MB) 72 Book value per share (BVPS) 73 74 1.014 $ 0.220 $ 7.809 $ 12.17 $ 250,000 40.00% 40,000 $ 0 (1.602) $ 0.110 $ 4.9265 2.25 $ 100,000 40.00% 40,000 $ 0 0.880 0.220 6.638 8.50 100,000 40.00% 40,000 0 $ 2019E 2018 1.2 0.4 4.7 38.2 6.4 2.1 73.4% -1.0 -2.2% -2.7% 4.6% -5.6% 32.5% -4.2% -1.4 0.5 $4.93 2017 2.3 0.8 4.8 37.4 10.0 2.3 44.1% 4.3 5.5% 2.6% 13.0% 6.0% 13.3% 9.6% 9.7 1.3 $6.64 Industry Average 2.7 1.0 6.1 32.0 7.0 2.6 40.0% 6.2 7.3% 3.5% 19.1% 9.1% 18.2% 14.5% 14.2 2.4 n.a. Calculate the 2019 total assets turnover. TA2019 75 76 77 78 1 TATO 2010 Sales 2019 TATO 2019 TATO 2019 #DIV/01 Calculate the 2019 profit margin, return on equity (ROE). PM2019 NI 2019 PM2019 PM2019 #DIV/01 Sales 2018 1 1 - 79 80 81 82 83 84 85 86 ROE 2019 Nl2019 1 Equity 2019 ROE 2019 1 ROE 2019 #DIV/01 Use the DuPont equation to provide a summary and overview of D'Leon's financial condition as projected for 2019. x 87 88 89 90 91 92 93 ROE 2010 = ROE2013 = ROE2019 = Equity multiplier 2019 Profit margina #DIV/0! #DIV/0! Total assets turnover 2019 #DIV/0! X X X