

Answered step by step
Verified Expert Solution
Question
1 Approved Answer
c. Calculate the coefficients of variation for Bartman, Reynolds, and the Winslow 5000. Round your answers to two decimal places. Download spreadsheet Evaluating Risk and
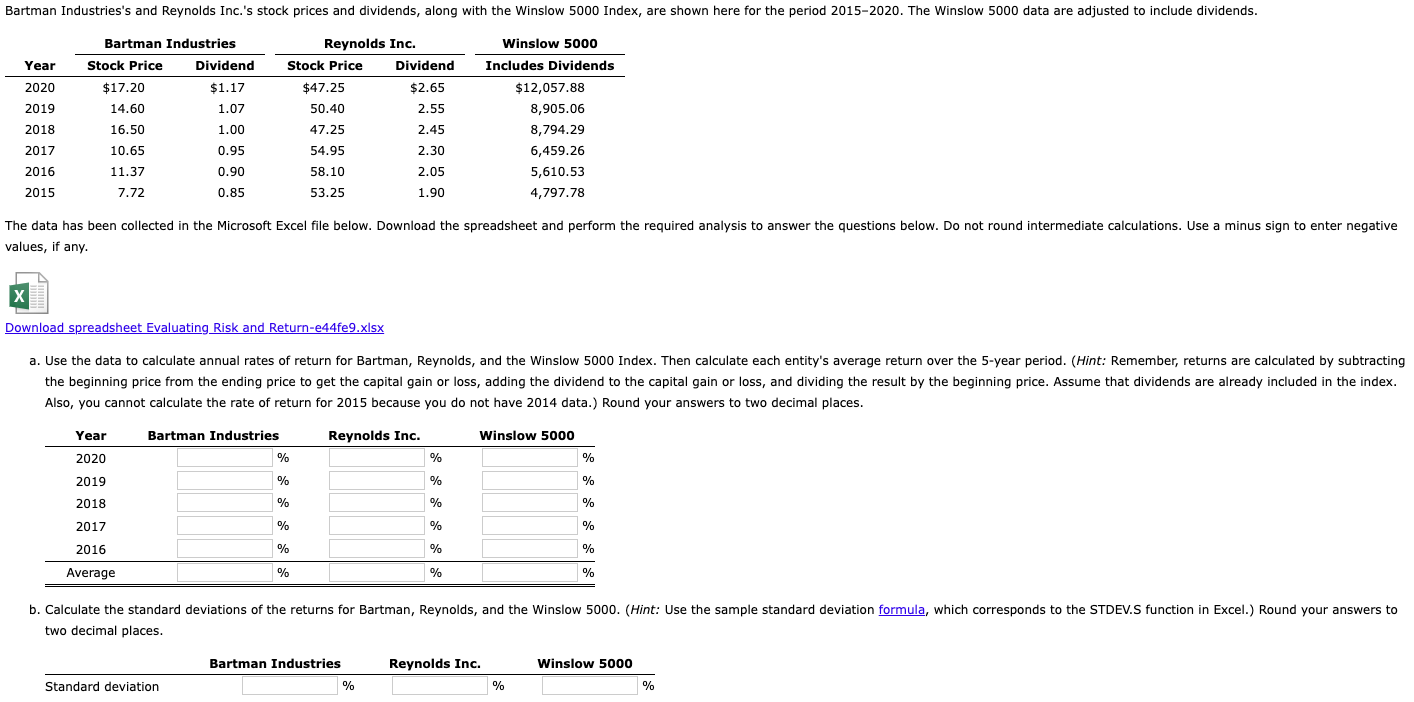
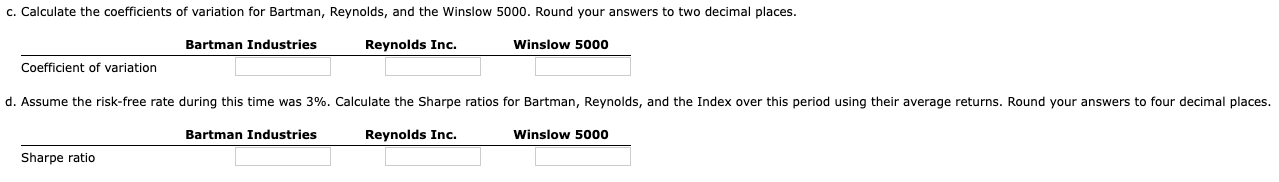
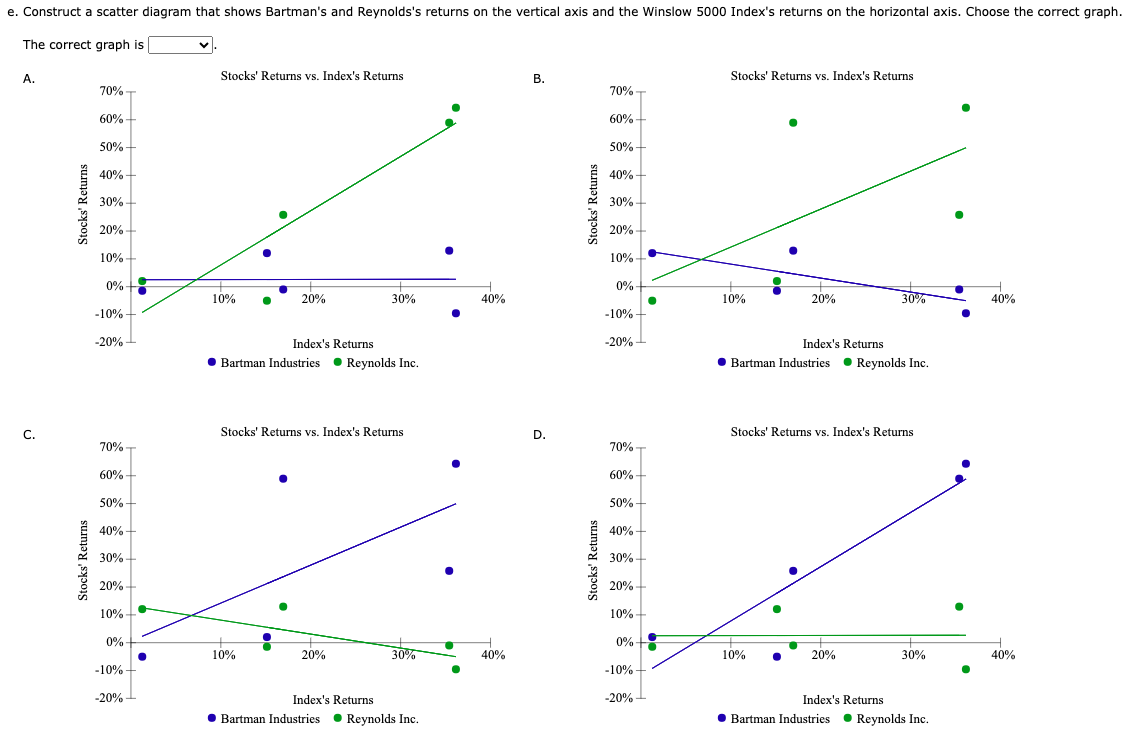
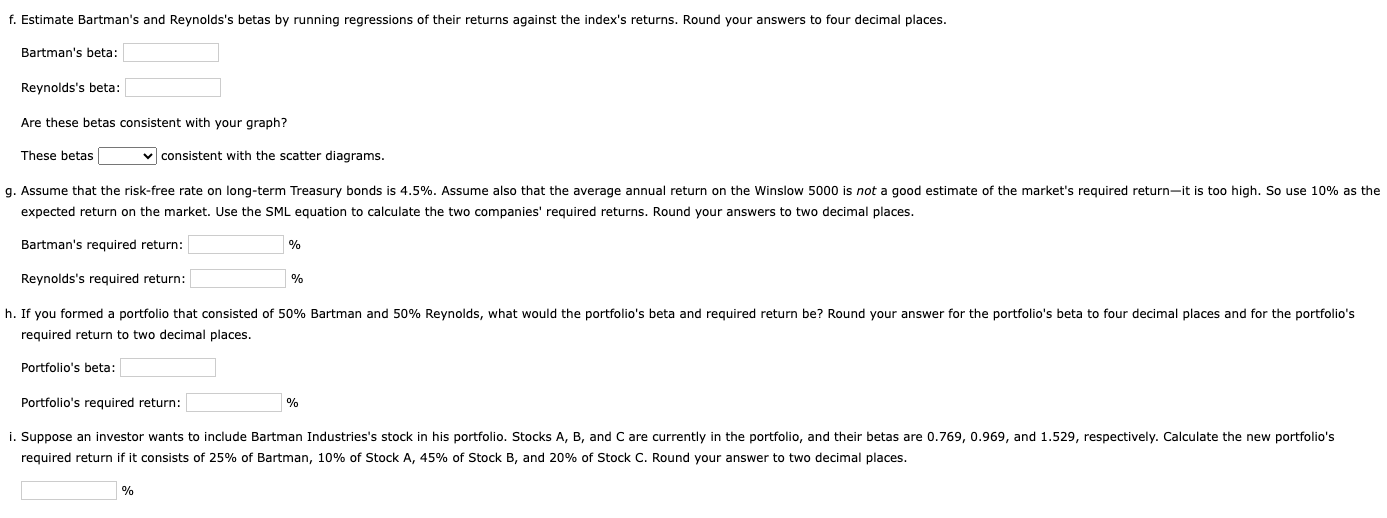 c. Calculate the coefficients of variation for Bartman, Reynolds, and the Winslow 5000. Round your answers to two decimal places. Download spreadsheet Evaluating Risk and Return-e44fe9.xlsx Also, you cannot calculate the rate of return for 2015 because you do not have 2014 data.) Round your answers to two decimal places. f. Estimate Bartman's and Reynolds's betas by running regressions of their returns against the index's returns. Round your answers to four decimal places. Bartman's beta: Reynolds's beta: Are these betas consistent with your graph? These betas consistent with the scatter diagrams. expected return on the market. Use the SML equation to calculate the two companies' required returns. Round your answers to two decimal places. Bartman's required return: % Reynolds's required return: % required return to two decimal places. Portfolio's beta: Portfolio's required return: % required return if it consists of 25% of Bartman, 10% of Stock A, 45% of Stock B, and 20% of Stock C. Round your answer to two decimal places. % e. Construct a scatter diagram that shows Bartman's and Reynolds's returns on the vertical axis and the Winslow 5000 Index's returns on the horizontal axis. Choose the correct graph The correct graph is
Step by Step Solution
There are 3 Steps involved in it
Step: 1

Get Instant Access to Expert-Tailored Solutions
See step-by-step solutions with expert insights and AI powered tools for academic success
Step: 2

Step: 3
Ace Your Homework with AI
Get the answers you need in no time with our AI-driven, step-by-step assistance
Get Started
Clinical Audit In Palliative Care
Authors: Irene Higginson
1st Edition
1870905644, 978-1870905640