

Answered step by step
Verified Expert Solution
Question
1 Approved Answer
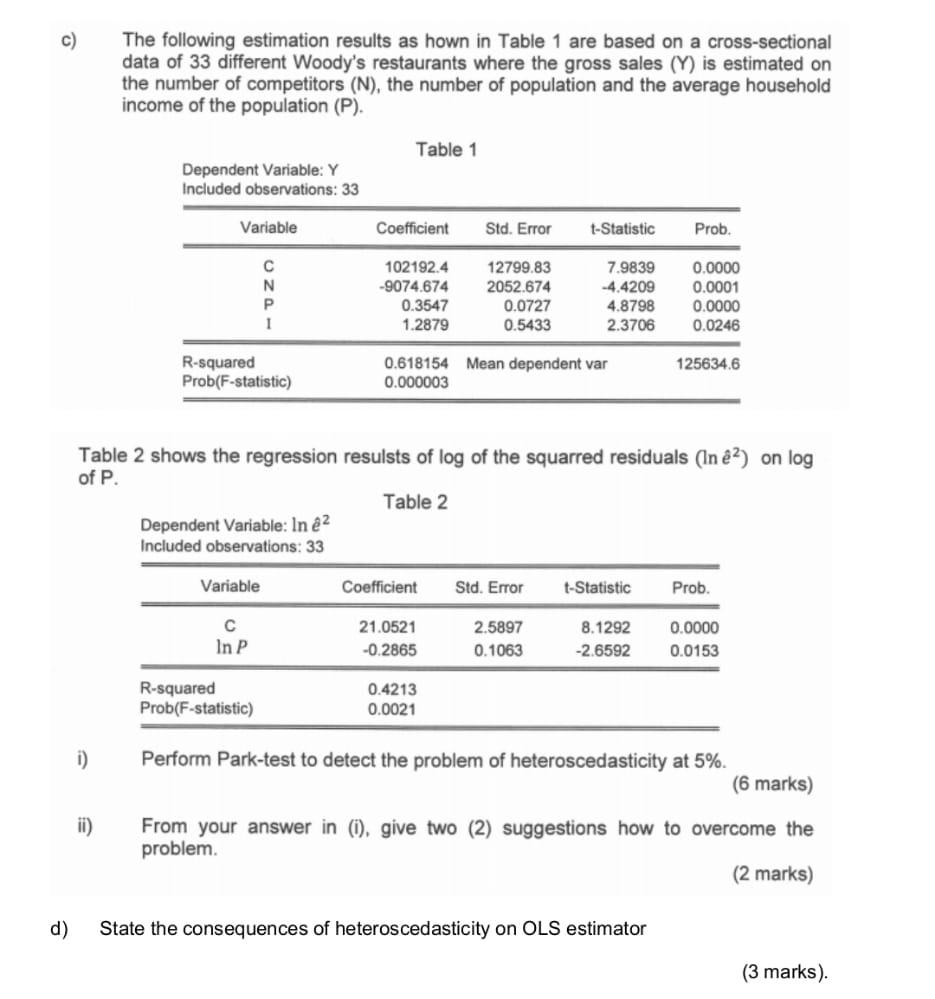
c) The following estimation results as hown in Table 1 are based on a cross-sectional data of 33 different Woody's restaurants where the gross sales
Step by Step Solution
There are 3 Steps involved in it
Step: 1

Get Instant Access to Expert-Tailored Solutions
See step-by-step solutions with expert insights and AI powered tools for academic success
Step: 2

Step: 3
Ace Your Homework with AI
Get the answers you need in no time with our AI-driven, step-by-step assistance
Get Started
Performance Audit A Case Study Of Indian Metro Railway Metropolitan Transport Project
Authors: Nilay Saha
1st Edition
3846510556, 978-3846510551