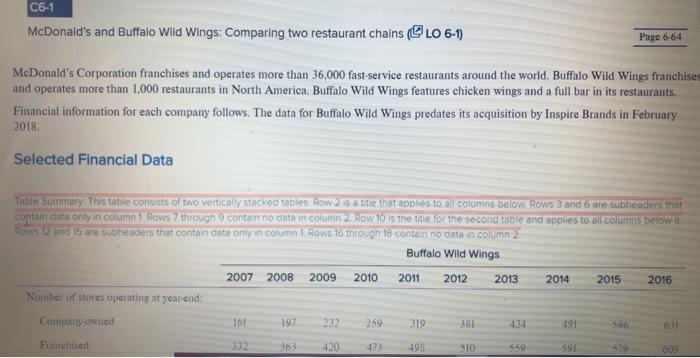
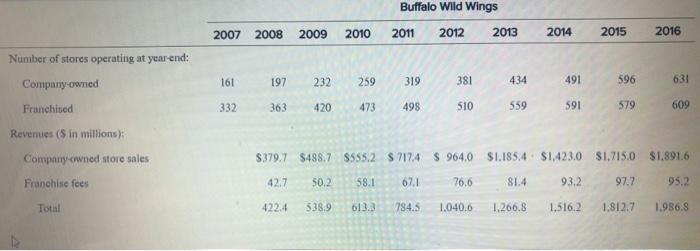
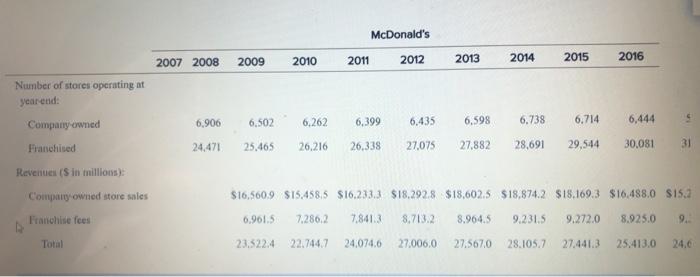
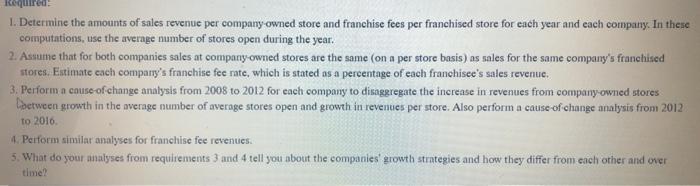
C6-1 McDonald's and Buffalo Wild Wings: Comparing two restaurant chalins (LO 6-1) Page 6-64 McDonald's Corporation franchises and operates more than 36,000 fast-service restaurants around the world. Buffalo Wild Wings franchise and operates more than 1,000 restaurants in North America. Buffalo Wild Wings features chicken wings and a full bar in its restaurants. Financial information for each company follows. The data for Buffalo Wild Wings predates its acquisition by Inspire Brands in February 2018. Selected Financial Data Toble Summary This table consists of two vertically stacked tables. Row 216 site that applies to columos below. Rows 3 and 6 ore subheader that contain dot only in column 1 Bows through contain no data in column 2 Row 10 10 the wie for the second table and applies to all columns below it Pows and 15 are subheaders that contain data only in column Rows 16 through 18 contain no data in column 2 Buffalo Wild Wings 2007 2008 2009 2010 2011 2012 2013 2014 2015 2016 Number of stores operating at yearend: Company owned TO 197 232 259 319 SI 134 191 Franchised 332 420 473 SIO 591 519 609 Buffalo Wild Wings 2007 2008 2009 2010 2011 2012 2013 2014 2015 2016 Number of stores operating at year end: Conipany-owned 161 197 232 259 319 381 434 491 596 631 Franchised 332 363 420 473 498 510 559 591 579 609 Revenues (S in millions): Company owned store sales $379.7 $488.7 SS55.2 $717.4 964.0 S1.185.4 $1,423,0 $1,715.0 S1.891.6 Franchise fees 42.7 50.2 58.1 67.1 76.6 81.4 93.2 97.7 95.2 Total 422.4 538.9 613.3 784.5 1.040.6 1.266.8 1.516,2 1.812.7 1.986.8 McDonald's 2007 2008 2009 2011 2010 2012 2015 2013 2016 2014 6,906 6,502 6,262 6,399 6,435 6,598 6.738 6.714 6,444 9 Number of stores operating at yearend: Company owned Franchised Revenues (Sin millons Company owned store sales 24,471 25,465 26,216 26,338 27.075 27,882 28.691 29.544 30.081 31 $16,560,9 $15,458,5 $16.233.3 $18.292.8 $18,602.5 $18,874.2 $18.169.3 $16.488.0 $15.2 Franchise fees 6.961.5 7.286.2 7.8413 8.713.2 8.964.5 9.231.5 9.272.0 8.925.0 9. Total 23.522.4 22.744.7 24.074.6 27.006.0 27.5670 28.105.7 27.441.3 25.413.0 Required: 1. Determine the amounts of sales revenue per company-owned store and franchise fees per franchised store for each year and each company. In these computations, use the average number of stores open during the year. 2. Assume that for both companies sales at company-owned stores are the same (on a per store basis) as sales for the same company's franchised stores. Estimate cach company's franchise fee rate, which is stated as a percentage of each franchisee's sales revenue. 3. Perform a cause of change analysis from 2008 to 2012 for each company to disaggregate the increase in revenues from company owned stores Laetween growth in the average number of average stores open and growth in revenues per store. Also perform a cause of change analysis from 2012 to 2016 4. Perform similar analyses for franchise fee revenues. 5. What do your analyses from requirements 3 and 4 tell you about the companies' growth strategies and how they differ from each other and over time? C6-1 McDonald's and Buffalo Wild Wings: Comparing two restaurant chalins (LO 6-1) Page 6-64 McDonald's Corporation franchises and operates more than 36,000 fast-service restaurants around the world. Buffalo Wild Wings franchise and operates more than 1,000 restaurants in North America. Buffalo Wild Wings features chicken wings and a full bar in its restaurants. Financial information for each company follows. The data for Buffalo Wild Wings predates its acquisition by Inspire Brands in February 2018. Selected Financial Data Toble Summary This table consists of two vertically stacked tables. Row 216 site that applies to columos below. Rows 3 and 6 ore subheader that contain dot only in column 1 Bows through contain no data in column 2 Row 10 10 the wie for the second table and applies to all columns below it Pows and 15 are subheaders that contain data only in column Rows 16 through 18 contain no data in column 2 Buffalo Wild Wings 2007 2008 2009 2010 2011 2012 2013 2014 2015 2016 Number of stores operating at yearend: Company owned TO 197 232 259 319 SI 134 191 Franchised 332 420 473 SIO 591 519 609 Buffalo Wild Wings 2007 2008 2009 2010 2011 2012 2013 2014 2015 2016 Number of stores operating at year end: Conipany-owned 161 197 232 259 319 381 434 491 596 631 Franchised 332 363 420 473 498 510 559 591 579 609 Revenues (S in millions): Company owned store sales $379.7 $488.7 SS55.2 $717.4 964.0 S1.185.4 $1,423,0 $1,715.0 S1.891.6 Franchise fees 42.7 50.2 58.1 67.1 76.6 81.4 93.2 97.7 95.2 Total 422.4 538.9 613.3 784.5 1.040.6 1.266.8 1.516,2 1.812.7 1.986.8 McDonald's 2007 2008 2009 2011 2010 2012 2015 2013 2016 2014 6,906 6,502 6,262 6,399 6,435 6,598 6.738 6.714 6,444 9 Number of stores operating at yearend: Company owned Franchised Revenues (Sin millons Company owned store sales 24,471 25,465 26,216 26,338 27.075 27,882 28.691 29.544 30.081 31 $16,560,9 $15,458,5 $16.233.3 $18.292.8 $18,602.5 $18,874.2 $18.169.3 $16.488.0 $15.2 Franchise fees 6.961.5 7.286.2 7.8413 8.713.2 8.964.5 9.231.5 9.272.0 8.925.0 9. Total 23.522.4 22.744.7 24.074.6 27.006.0 27.5670 28.105.7 27.441.3 25.413.0 Required: 1. Determine the amounts of sales revenue per company-owned store and franchise fees per franchised store for each year and each company. In these computations, use the average number of stores open during the year. 2. Assume that for both companies sales at company-owned stores are the same (on a per store basis) as sales for the same company's franchised stores. Estimate cach company's franchise fee rate, which is stated as a percentage of each franchisee's sales revenue. 3. Perform a cause of change analysis from 2008 to 2012 for each company to disaggregate the increase in revenues from company owned stores Laetween growth in the average number of average stores open and growth in revenues per store. Also perform a cause of change analysis from 2012 to 2016 4. Perform similar analyses for franchise fee revenues. 5. What do your analyses from requirements 3 and 4 tell you about the companies' growth strategies and how they differ from each other and over time