Answered step by step
Verified Expert Solution
Question
1 Approved Answer
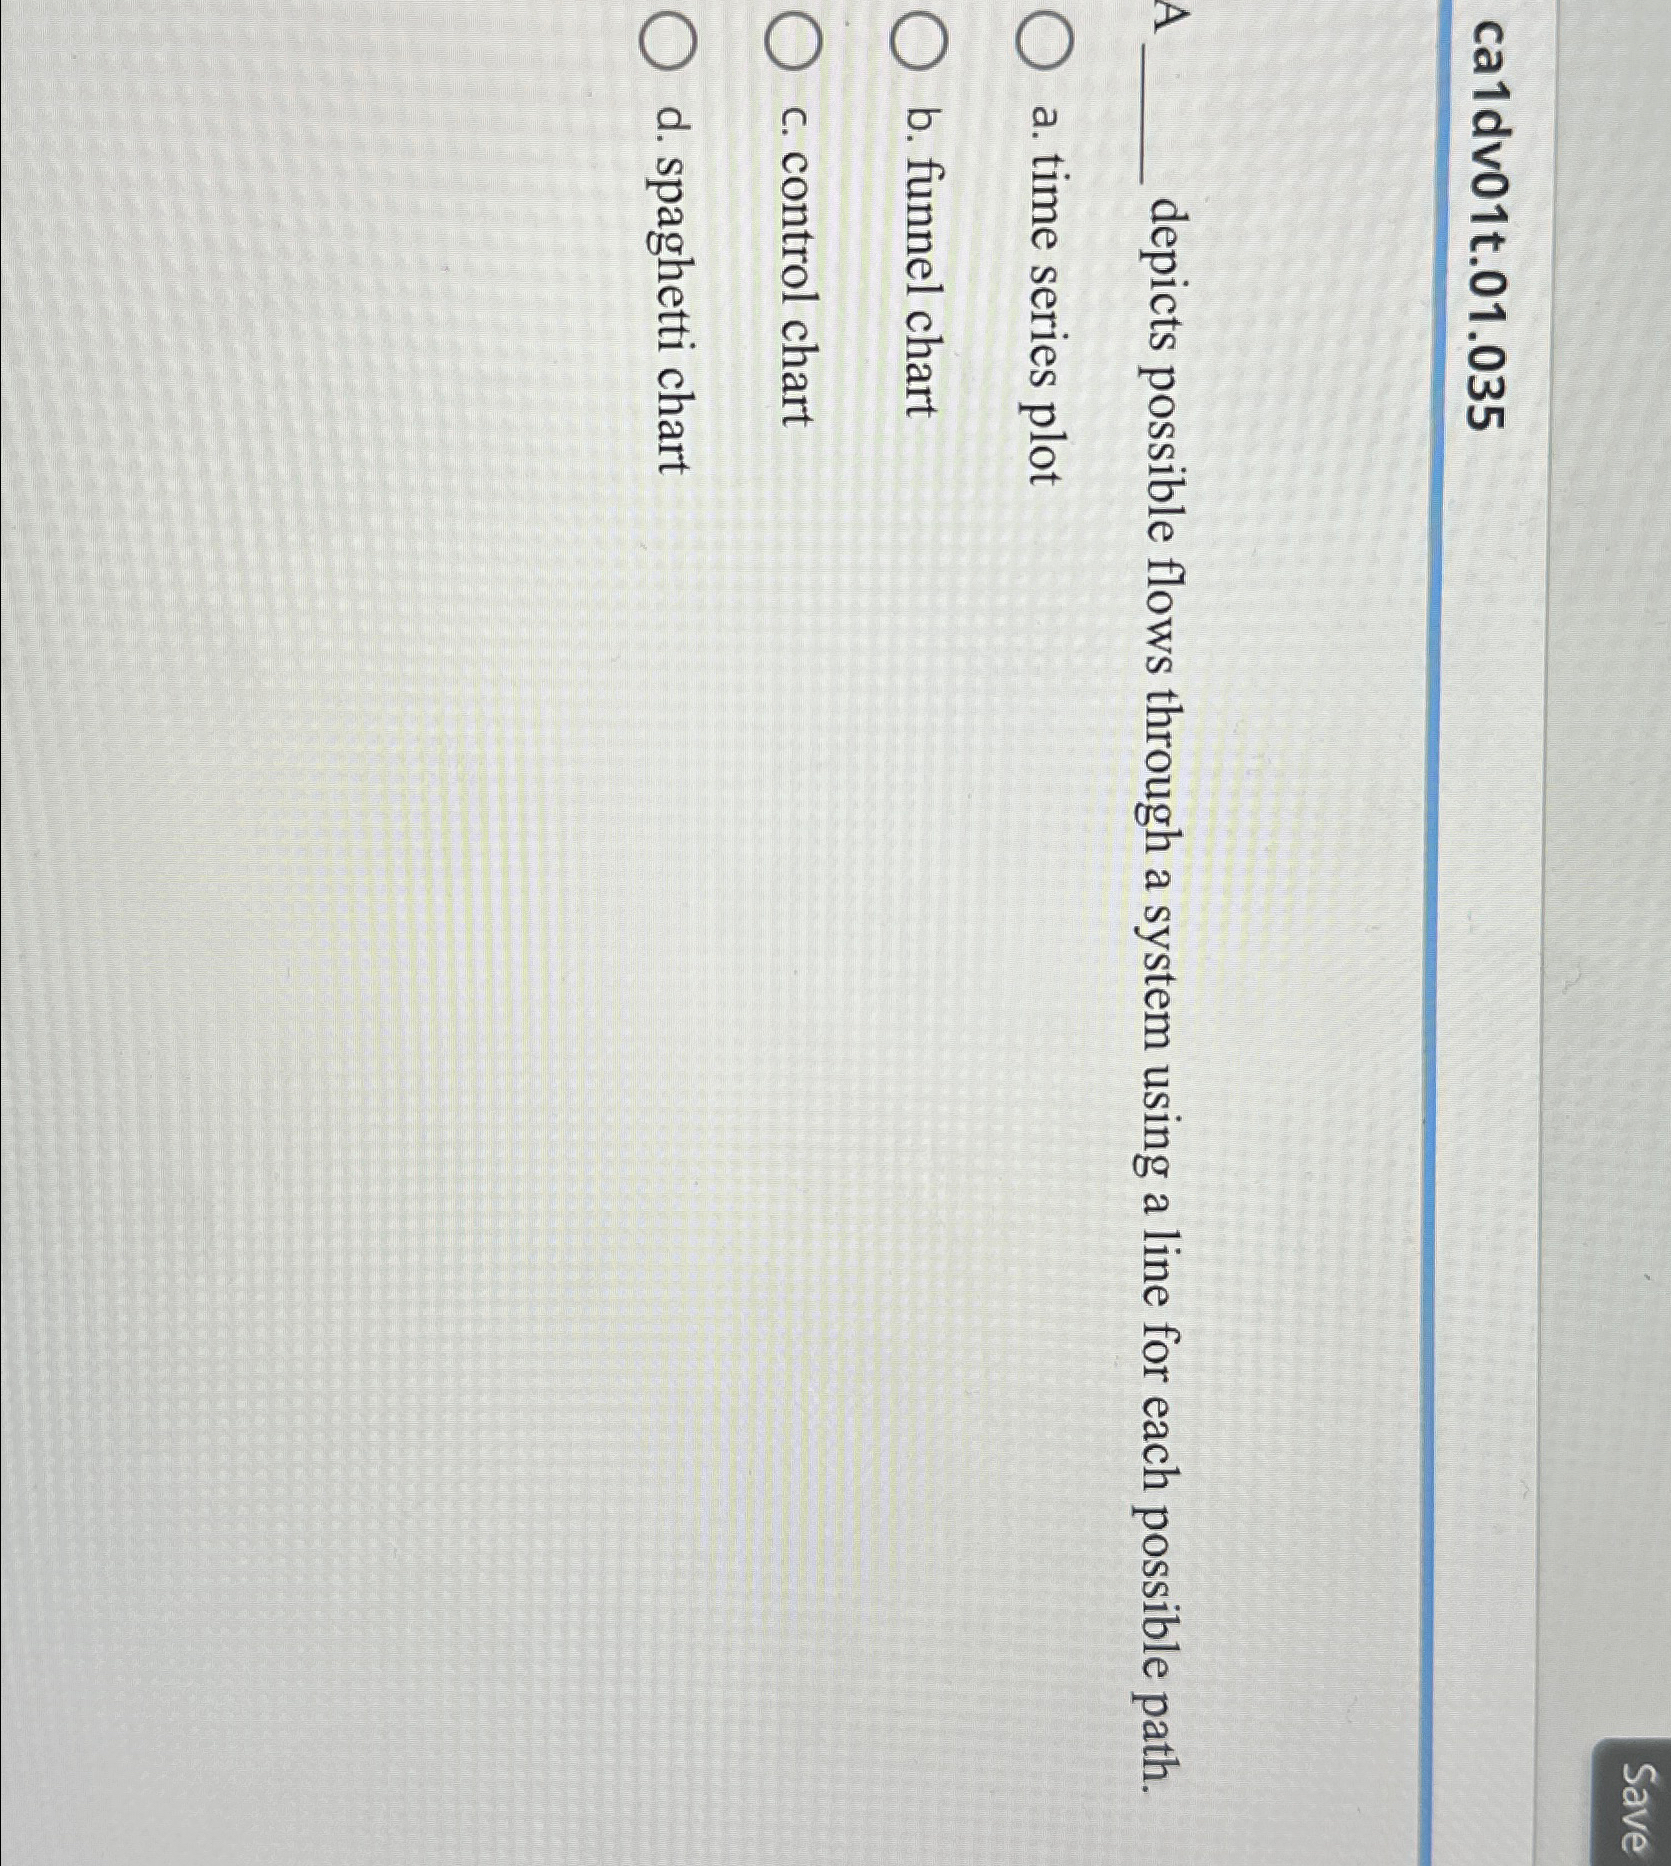
ca 1 dv 0 1 t . 0 1 . 0 3 5 A depicts possible flows through a system using a line for each
cadvt
A depicts possible flows through a system using a line for each possible path.
a time series plot
b funnel chart
c control chart
d spaghetti chart

Step by Step Solution
There are 3 Steps involved in it
Step: 1

Get Instant Access to Expert-Tailored Solutions
See step-by-step solutions with expert insights and AI powered tools for academic success
Step: 2

Step: 3

Ace Your Homework with AI
Get the answers you need in no time with our AI-driven, step-by-step assistance
Get Started


