Question
C.Accumulation and Graphical Integration and Differentiation Stocks are accumulations. The difference between the inflows and outflows of a stock accumulates, altering the level of the
C.Accumulation and Graphical Integration and Differentiation
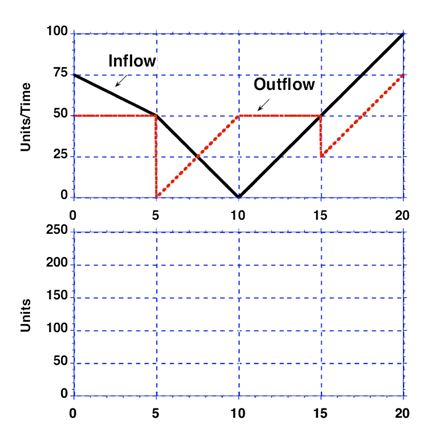
Stocks are accumulations. The difference between the inflows and outflows of a stock accumulates, altering the level of the stock variable. The process of accumulation gives stocks inertia and memory and creates delays. Since realistic models are far too complex to solve with formal analysis, it is important to understand the relationship between flows and the behavior of stocks intuitively. Consider the following system:

Do not use the computer. The goal is to develop your intuition about stocks and flows.
C1. On a graph, draw the trajectory of the stock given the inflow and outflow rates shown. Indicate the numerical values for any maxima or minima, and for the maximum or minimum values of the slope for the stock. Assume the initial quantity in the stock is 100 units

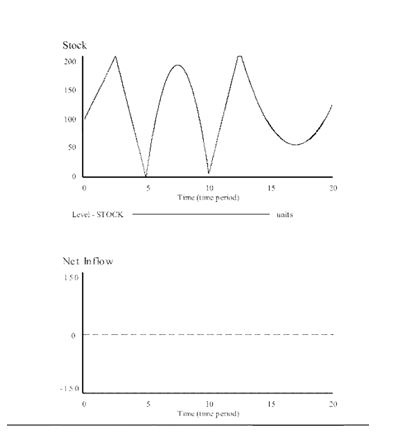
C2. This exercise asks you to graphically differentiate a stock to understand the behavior of the net rate of flow to the stock. By estimating the slope of the stock at each point, create a graph of the net rate of change in the stock. That is, in the graph below you are given the behavior of the stock over time and must infer the behavior of its net inflow. (This is the inverse operation of graphical integration, the previous exercise.) Graphically differentiate the stock and provide numerical values for key points in the net flow graph (maxima and minima).

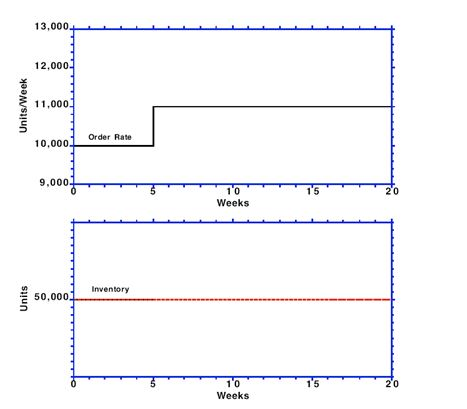
C3. Consider a manufacturing firm. The firm maintains an inventory of finished product. The firm uses this inventory to fill customer orders as they come in. Historically,
Units/Week orders have averaged 10,000 units per week. The firm strives to maintain an inventory of 50,000 units to provide excellent customer service (that is, to be able to fill essentially 100% of every order). Although the firm has ample capacity to handle variations in demand, it takes time to adjust the production schedule, and to make the producta total lag of four weeks. Now imagine that the order rate for the firms products suddenly and unexpectedly rises by 10%, and remains at the new, higher rate, as shown in the graph below. Before the change in demand, production was equal to orders at 10,000 units/week, and inventory was equal to the desired level of 50,000 units.
Sketch the likely path of production and inventory on the graphs below. Provide an appropriate scale for the graph of inventory. Explain briefly.

Step by Step Solution
There are 3 Steps involved in it
Step: 1

Get Instant Access to Expert-Tailored Solutions
See step-by-step solutions with expert insights and AI powered tools for academic success
Step: 2

Step: 3

Ace Your Homework with AI
Get the answers you need in no time with our AI-driven, step-by-step assistance
Get Started


