Calculate a DCF range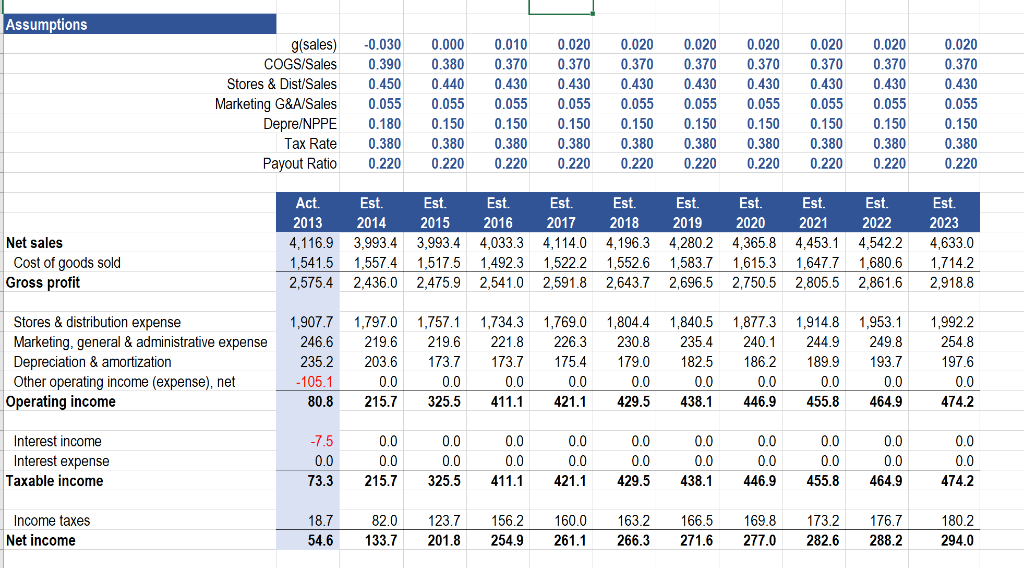
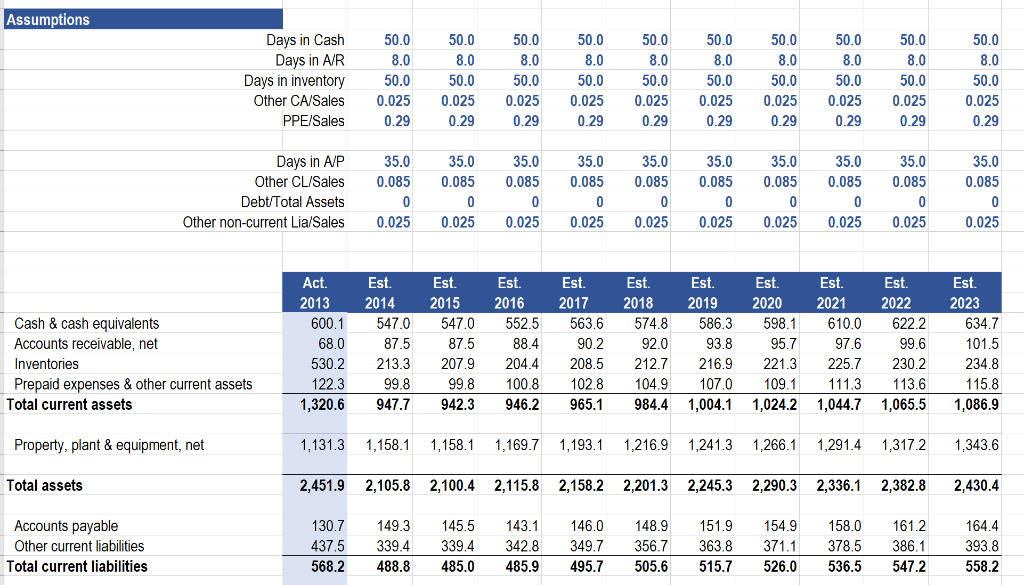
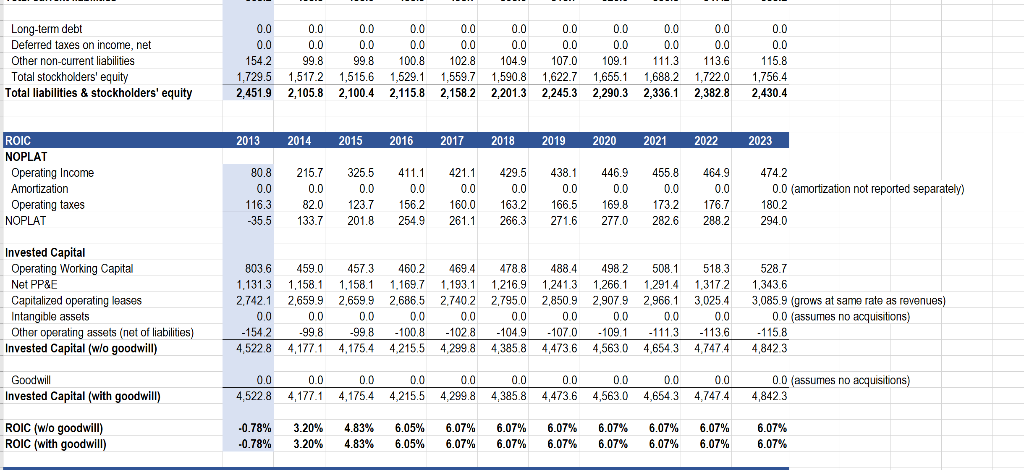

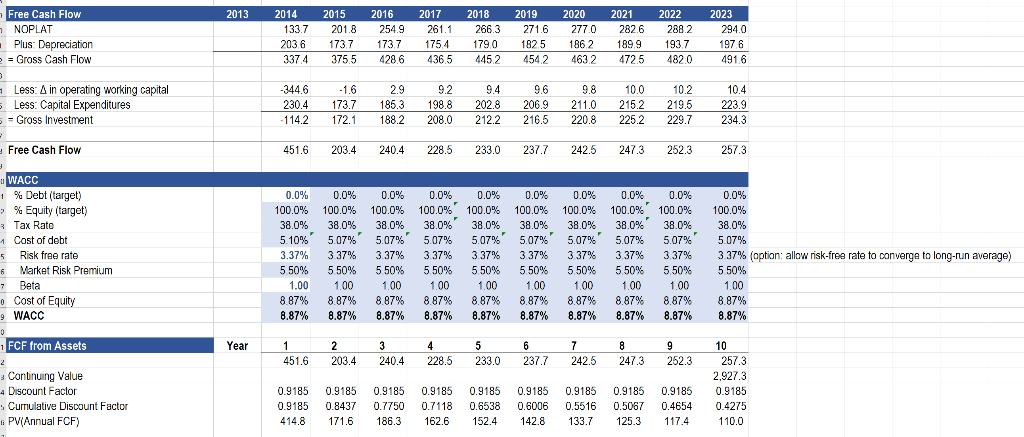
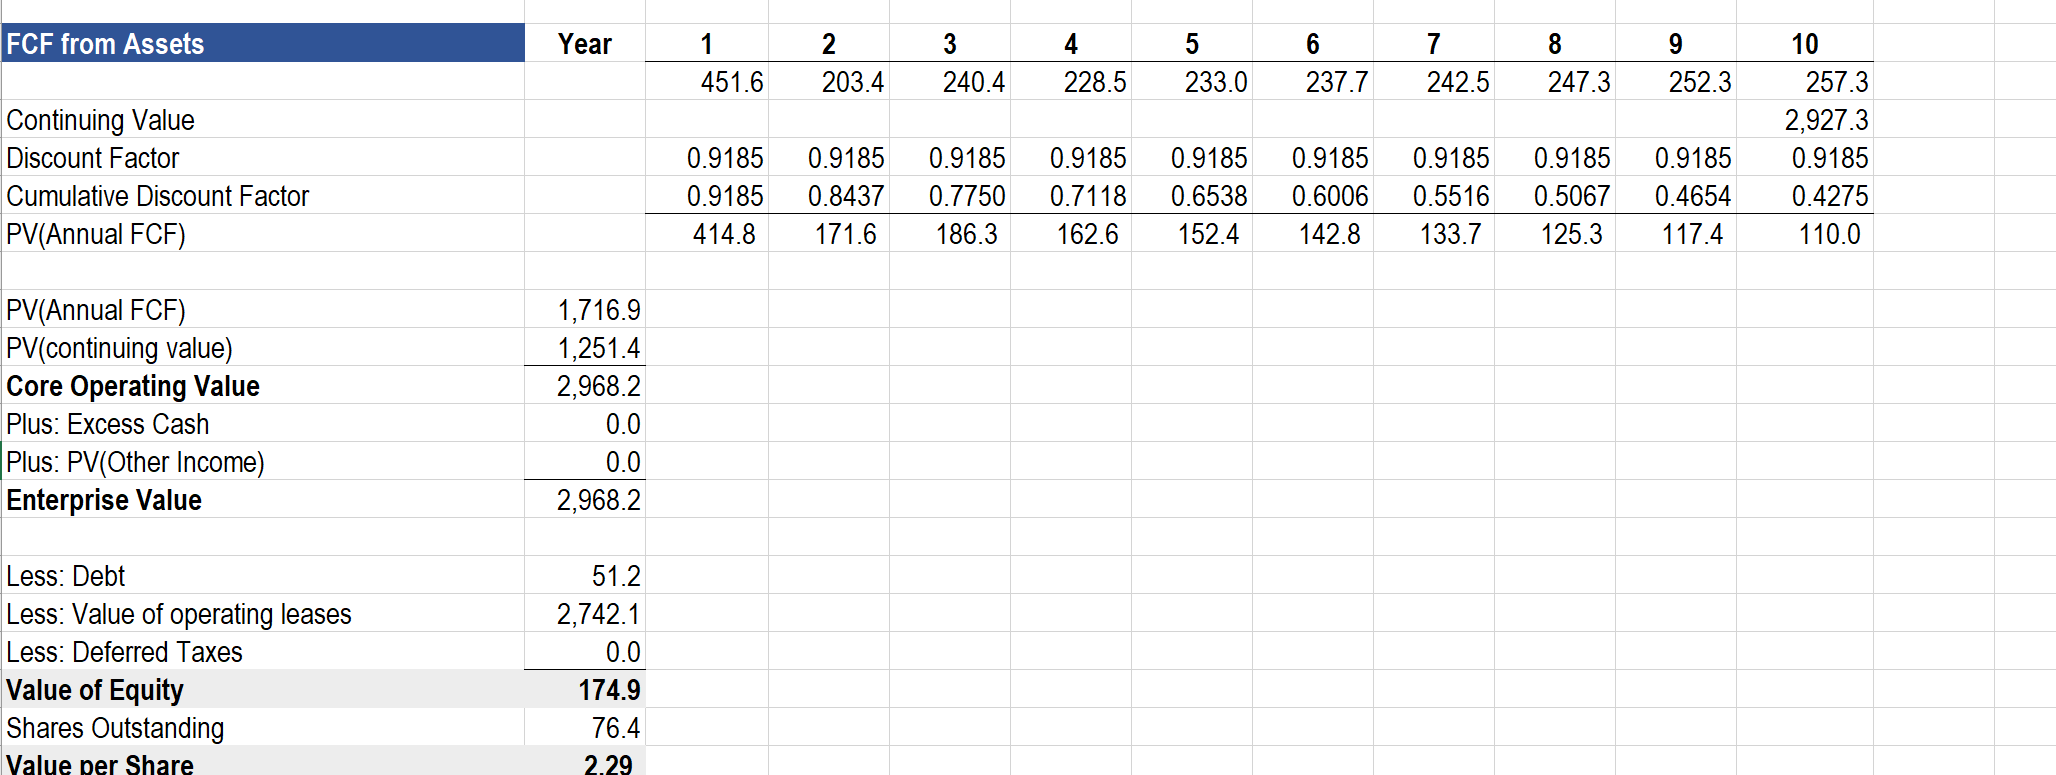
Assumptions g(sales) COGS/Sales Stores & Dist/Sales Marketing G&A/Sales Depre/NPPE Tax Rate Payout Ratio -0.030 0.390 0.450 0.055 0.180 0.380 0.220 0.000 0.380 0.440 0.055 0.150 0.380 0.220 0.010 0.370 0.430 0.055 0.1500 0.380 0.220 0.020 0.370 0.430 0.055 .150 0.380 0.220 0.020 0.370 0.430 0.055 0.150 0.380 0.220 0.020 0.370 0.430 0.055 0.150 0.380 0.220 0.020 0.370 0.430 0.055 0.150 0.380 0.220 0.020 0.370 0.430 0.055 .150 0.380 0.220 0.020 0.370 0.430 0.055 0.150 0.380 0.220 0.020 0.370 0.430 0.055 0.150 0.380 0.220 0 Net sales Cost of goods sold Gross profit Act. 2013 4,116.9 1,541.5 2,575.4 Est. 2014 3,993.4 1,557,4 2,436.0 Est 2015 3,993.4 1,517.5 2,475.9 Est. 2016 4,033.3 1,492.3 2,541.0 Est. 2017 4,114.0 1,5222 2,591.8 Est. 2018 4.196.3 1,552.6 2,643.7 Est. 2019 4.280.2 1,583.7 2,696.5 Est. 2020 4.365.8 1,615.3 2,750.5 Est. 2021 4,453.1 1,647.7 2,805.5 Est 2022 4,542.2 1,680.6 2,861.6 Est. 2023 4,633.0 1,714.2 2,918.8 Stores & distribution expense Marketing, general & administrative expense Depreciation & amortization Other operating income (expense), net Operating income 1,907.7 246.6 235.2 -105.1 80.8 1,797.0 219.6 203.6 0.0 215.7 1,757.1 219.6 173.7 0.0 325.5 1,734.3 221.8 173.7 0.0 411.1 1,769.0 226.3 175.4 0.0 421. 1 1,804.4 230.8 179.0 0.0 4 29.5 1,840.5 235.4 182.5 0.0 438.1 1.877.3 240.1 186.2 0.0 446.9 1,914.8 244.9 189.9 0.0 455.8 1,953.1 249.8 193.7 0.0 464.9 1,992.2 254.8 197.6 100 ao 20.5 428.9 0.0 474.2 Interest income Interest expense Taxable income -7.5 0.0 73.3 0.0 0.0 215.7 0.0 0.0 325.5 0.0 0.0 411. 1 0.0 0.0 421.1 0.0 0.0 429.5 0.0 0.0 438.1 0.0 0.0 446.9 0.0 0.0 455.8 0.0 0.0 464.9 0.0 0.0 474.2 Income taxes Net income 18.7 54.6 82.0 133.7 123.7 201.8 156.2 254.9 160.0 261.1 163.2 266.3 166. 5 271.6 1 69.8 277.0 173.2 282.6 176.7 288.2 180.2 294.0 Assumptions 50.0 8.0 Days in Cash Days in A/R Days in inventory Other CA/Sales PPE/Sales 50.0 8.0 50.0 0.025 0.29 50.0 8.0 50.0 50.0 8.0 50.0 50.0 8.0 50.0 50.0 8.0 50.0 0.025 0.29 50.0 8.0 50.0 0.025 0.29 50.0 8.0 50.0 0.025 0.29 50.0 8.0 50.0 50.0 8.0 50.0 0.025 0.29 0.29 0.29 0.29 0.29 0.29 35.0 0 0.085 Days in A/P Other CL/Sales Debt/Total Assets Other non-current Lia/Sales 35.0 0.085 0 0.025 35.0 0.085 0 0.025 35.0 0.085 0 0.025 35.0 0.085 0 0.025 35.0 0.085 0 0.025 35.0 0.085 0 0.025 35.0 .085 0 0.025 35.0 0.085 0 0.025 35.0 0.085 0 0.025 0.025 Cash & cash equivalents Accounts receivable, net Inventories Prepaid expenses & other current assets Total current assets Act. 2013 600. 1 68.0 530.2 122.3 1,320.6 Est. 2014 547. 0 87.5 213.3 99.8 947.7 Est. 2015 5470 87.5 207.9 99.8 942. 3 Est. 2016 552.5 88.4 204.4 100.8 946.2 Est. 2017 563.6 90.2 208.5 102.8 965. 1 Est. 2018 574.8 92.0 212.7 104.9 984.4 Est. 2019 586.3 93.8 216.9 107.0 1,004.1 Est 2020 598.1 95.7 221.3 109.1 1,024.2 Est. 2021 610.0 97.6 225.7 111.3 1,044.7 Est. 2022 622.2 99.6 230.2 113.6 1,065.5 Est. 2023 634.7 101.5 234.8 115.8 1,086.9 Property, plant & equipment, net 1,131.3 1,158.1 1,158.1 1,169.7 1,193.1 1,216.9 1,241.3 1,266.1 1,291.4 1,317.2 1,343.6 Total assets 2,451.9 2,105.8 2,100.4 2,115.8 2,158.2 2,201.3 2,245.3 2,290.3 2,336.1 2,382.8 2,430.4 Accounts payable Other current liabilities Total current liabilities 130.7 437.5 568.2 149.3 339.4 488.8 145.5 339.4 485.0 143.1 342.8 485. 9 146.0 349. 7 495.7 148.9 356.7 505.6 151.9 363.8 515.7 154.9 371.1 526.0 158.0 378.5 536.5 161.2 386.1 547.2 164.4 393.8 558.2 Long-term debt Deferred taxes on income, net Other non-current liabilities Total stockholders' equity Total liabilities & stockholders' equity 0.0 0.0 154.2 1,729.5 2,451.9 0.0 0.0 99. 8 1,517.2 2,105.8 0.0 0.0 9 9.8 1,515.6 2,100.4 0.0 0.0 100.8 1,529.1 2,115.8 0.0 0.0 102.8 1,559.7 2,158.2 0.0 0.0 104.9 1,590.8 2,201.3 0.0 0.0 107.0 1,622.7 2,245.3 0.0 0.0 109.1 1,655.1 2,290.3 0.0 0.0 111.3 1,688.2 2,336.1 0.0 0.0 113.6 1,722.0 2,382.8 0.0 0.0 115.8 1,756.4 2,430.4 2013 2014 2015 2016 2017 2018 2019 2020 2021 2022 2023 ROIC NOPLAT Operating Income Amortization Operating taxes NOPLAT 80.8 0.0 116.3 -35.5 215.7 0.0 82.0 133.7 325.5 0.0 123.7 201.8 411.1 0.0 156.2 254.9 421. 1 0.0 160.0 261.1 429.5 0.0 163.2 266.3 438.1 0.0 166.5 271.6 446.9 0.0 169.8 277.0 455.8 0.0 173.2 282.6 464.9 0.0 176.7 288.2 474.2 0.0 (amortization not reported separately) 1802 294.0 Invested Capital Operating Working Capital Net PP&E Capitalized operating leases Intangible assets Other operating assets (net of liabilities) Invested Capital (wlo goodwill) 803.6 1,131.3 2,742.1 00 -1542 4,522 8 459.0 1.158.1 2659.9 00 -998 4,177,1 4573 1.158.1 2,659.9 00 -99.8 4,175.4 460.2 1.169.7 2,686.5 00 -100.8 4,215,5 469.4 1.193.1 2,7402 00 -102.8 4,299.8 478.8 1,216.9 2,795.0 00 -104.9 4,385,8 488.4 1.241.3 2,850,9 00 -107.0 4,473 6 498.2 1.266.1 2,9079 00 -109.1 4,563,0 508. 1 1.291.4 2,966,1 00 -111.3 4,6543 518.3 1.317.2 3,025.4 00 -113.6 4.747,4 528.7 1,343.6 3,085.9 (grows at same rate as revenues) 00 (assumes no acquisitions) -115.8 4,8423 Goodwill Invested Capital (with goodwill) 0.0 4.522.8 0.0 4.177.1 0.0 4,175.4 0.0 4,215.5 0.0 4.299.8 0.0 4,385.8 0.0 4,473.6 0.0 4,563.0 0.0 4,654.3 0.0 4.747.4 0.0 (assumes no acquisitions) 4,842.3 ROIC (w/o goodwill) ROIC (with goodwill) -0.78% -0.78% 3.20% 3.20% 4.83% 4.83% 6.05% 6.05% 6.07% 6.07% 6.07% 6.07% 6.07% 6.07% 6.07% 6.07% 6.07% 6.07% 6.07% 6.07% 6.07% 6.07% 2013 Free Cash Flow NOPLAT Plus: Depreciation = Gross Cash Flow 2014 133.7 2036 3374 2015 2018 1737 3755 2016 254.9 1737 428 6 2017 261.1 1754 4365 2018 2663 179.0 4452 2019 271.6 1825 454 2 2020 2770 186.2 4632 2021 282.6 189.9 4725 2022 288.2 193.7 4820 2023 294.0 1976 4916 - Less: A in operating working capital Less: Capital Expenditures == Gross Investment 344.6 230.4 - 114.2 -1.6 173.7 172.1 2.9 185.3 188.2 9.2 198.8 208.0 9.4 202.8 2122 9.6 206.9 216.5 9.8 211.0 220.8 10.0 215.2 225.2 10.2 219.5 229.7 10.4 223.9 234.3 Free Cash Flow 451.6 203.4 240.4 228.5 233.0 237.7 242.5 247.3 252.3 257.3 WACC 1 % Debt (target) 7 % Equity (target) 3 Tax Rate 1 Cost of debt 5 Risk free rate 6 Market Risk Premium 7 Beta Cost of Equity 9 WACC 0.0% 100.0% 38.0% 5.10% 3.37% 5 50% 1.00 8.87% 8.87% 0.0% 100.0% 38.0% 5.07% 3.37% 550% 100 8.87% 8.87% 0.0% 100.0% 38.0% 5.07% 3.37% 550% 100 8.87% 8.87% 0.0% 100.0% 38.0% 5.07% 337% 550% 100 8.87% 8.87% 0.0% 100.0% 38.0% 5.07% 3.37% 550% 100 8.87% 8.87% 0.0% 100.0% 38.0% 5.07% 3.37% 550% 100 8.87% 8.87% 0.0% 100.0% 38.0% 5.07% 3.37% 550% 1.00 8.87% 8.87% 0.0% 100.0% 38.0% 5.07% 3.37% 550% 1.00 8.87% 8.87% 0.0% 100.0% 38.0% 5.07% 3.37% 550% 1.00 8.87% 8.87% 0.0% 100.0% 38,0% 5.07% 3.37% (aption: allow risk-free rate to converge to long-run average) 550% 1.00 8.87% 8.87% 1 FCF from Assets Year 2 203.4 5 233.0 6 237.7 7 242.5 8 247.3 451.6 240.4 228.5 252.3 3 Continuing Value 4 Discount Factor Curriulative Discount Factor .PV[Annual FCF) 0.9185 0.9185 414.8 0.9185 0.8437 171.6 0.9185 0.7750 186.3 0.9185 0.7118 162.6 0.9185 0.6538 152.4 0.9185 0.6006 142.8 0.9185 0.5516 133.7 0.9185 0.5067 125.3 0.9185 0.4654 117.4 10 257.3 2,927.3 0.9185 0.4275 110.0 2013 Free Cash Flow NOPLAT Plus: Depreciation = Gross Cash Flow 2014 133.7 2036 3374 2015 2018 1737 3755 2016 254.9 1737 428 6 2017 261.1 1754 4365 2018 2663 179.0 4452 2019 271.6 1825 454 2 2020 2770 186.2 4632 2021 282.6 189.9 4725 2022 288.2 193.7 4820 2023 294.0 1976 4916 - Less: A in operating working capital Less: Capital Expenditures == Gross Investment 344.6 230.4 - 114.2 -1.6 173.7 172.1 2.9 185.3 188.2 9.2 198.8 208.0 9.4 202.8 2122 9.6 206.9 216.5 9.8 211.0 220.8 10.0 215.2 225.2 10.2 219.5 229.7 10.4 223.9 234.3 Free Cash Flow 451.6 203.4 240.4 228.5 233.0 237.7 242.5 247.3 252.3 257.3 WACC 1 % Debt (target) 7 % Equity (target) 3 Tax Rate 1 Cost of debt 5 Risk free rate 6 Market Risk Premium 7 Beta Cost of Equity 9 WACC 0.0% 100.0% 38.0% 5.10% 3.37% 5 50% 1.00 8.87% 8.87% 0.0% 100.0% 38.0% 5.07% 3.37% 550% 100 8.87% 8.87% 0.0% 100.0% 38.0% 5.07% 3.37% 550% 100 8.87% 8.87% 0.0% 100.0% 38.0% 5.07% 337% 550% 100 8.87% 8.87% 0.0% 100.0% 38.0% 5.07% 3.37% 550% 100 8.87% 8.87% 0.0% 100.0% 38.0% 5.07% 3.37% 550% 100 8.87% 8.87% 0.0% 100.0% 38.0% 5.07% 3.37% 550% 1.00 8.87% 8.87% 0.0% 100.0% 38.0% 5.07% 3.37% 550% 1.00 8.87% 8.87% 0.0% 100.0% 38.0% 5.07% 3.37% 550% 1.00 8.87% 8.87% 0.0% 100.0% 38,0% 5.07% 3.37% (aption: allow risk-free rate to converge to long-run average) 550% 1.00 8.87% 8.87% 1 FCF from Assets Year 2 203.4 5 233.0 6 237.7 7 242.5 8 247.3 451.6 240.4 228.5 252.3 3 Continuing Value 4 Discount Factor Curriulative Discount Factor .PV[Annual FCF) 0.9185 0.9185 414.8 0.9185 0.8437 171.6 0.9185 0.7750 186.3 0.9185 0.7118 162.6 0.9185 0.6538 152.4 0.9185 0.6006 142.8 0.9185 0.5516 133.7 0.9185 0.5067 125.3 0.9185 0.4654 117.4 10 257.3 2,927.3 0.9185 0.4275 110.0 FCF from Assets Year 6 1 451.6 2 203.4 3 240.4 4 228.5 5 233.0 237.7 7 242.5 8 247.3 9 252.3 Continuing Value Discount Factor Cumulative Discount Factor PV(Annual FCF) 10 257.3 2,927.3 0.9185 0.4275 110.0 0.9185 0.9185 414.8 0.9185 0.8437 171.6 0.9185 0.7750 186.3 0.9185 0.7118 162.6 0.9185 0.6538 152.4 0.9185 0.6006 142.8 0.9185 0.5516 133.7 0.9185 0.5067 125.3 0.9185 0.4654 117.4 PV(Annual FCF) PV(continuing value) Core Operating Value Plus: Excess Cash Plus: PV(Other Income) Enterprise Value 1,716.9 1.251.4 2,968.2 0.0 0.0 2,968.2 Less: Debt Less: Value of operating leases Less: Deferred Taxes Value of Equity Shares Outstanding Value per Share 51.2 2,742.1 0.0 174.9 76.4 2.29