Calculate all below viability indicators for project alternatives (A & B)
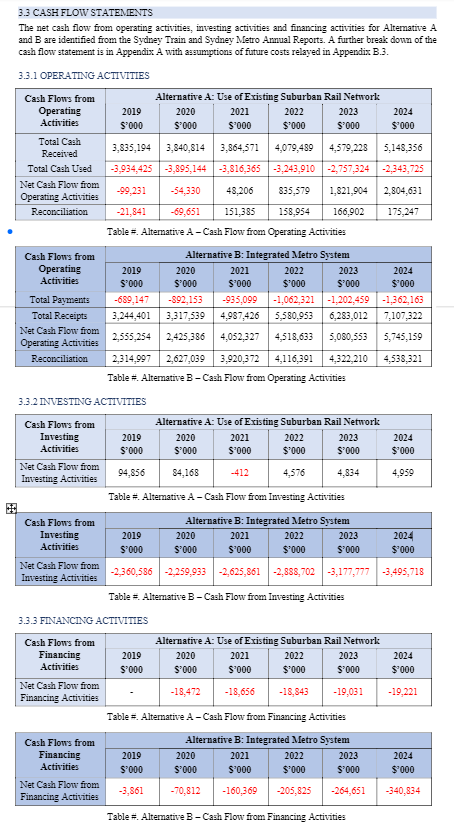
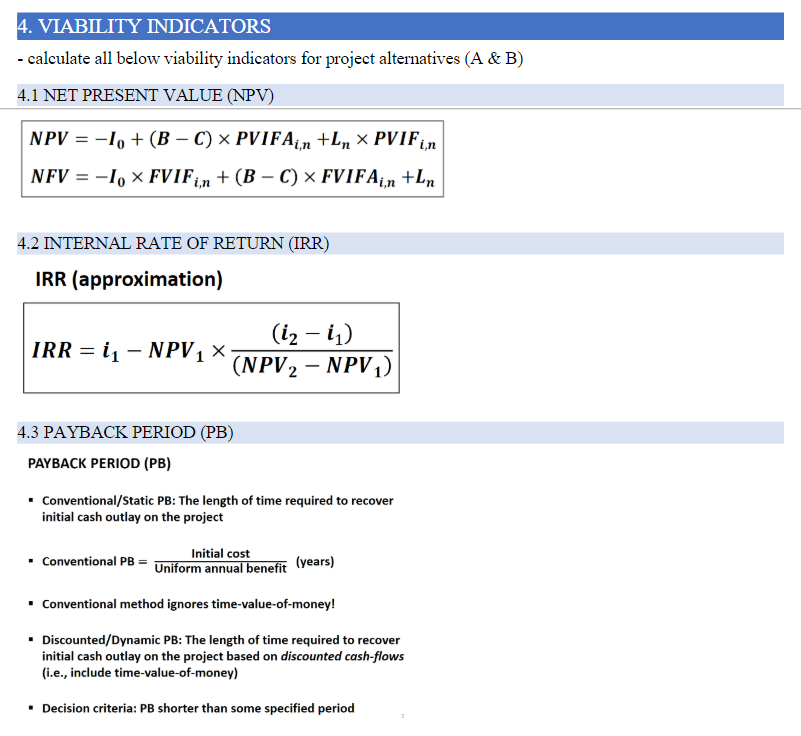
3.3 CASH FLOW STATEMENTS The net cash flow from operating activities, investing activities and financing activities for Altemative A and B are identified from the Sydney Train and Sydney Metro Annual Reports. A further break down of the cash flow statement is in Appendix A with assumptions of future costs relayed in Appendix B.3. 3.3.1 OPERATING ACTIVITIES Table =. Alternative A - Cash Flow from Operating Activities Table =. Altemative B - Cash Flow from Operating Activities 3.3.2 INVESTING ACTIVITIES Table =. Alternative A - Cash Flow from Investing Activities Table =. Altemative B - Cash Flow from Investing Activities 3.3.3 FINANCING ACTIVITIES Table =. Altemative A - Cash Flow from Financing Activities Table =. Alternative B - Cash Flow from Financing Activities - calculate all below viability indicators for project alternatives (A \& B) 4.1 NET PRESENT VALUE (NPV) NPV=I0+(BC)PVIFAi,n+LnPVIFi,nNFV=I0FVIFi,n+(BC)FVIFAi,n+Ln 4.2 INTERNAL RATE OF RETURN (IRR) IRR (approximation) IRR=i1NPV1(NPV2NPV1)(i2i1) 4.3 PAYBACK PERIOD (PB) PAYBACK PERIOD (PB) - Conventional/Static PB: The length of time required to recover initial cash outlay on the project - Conventional PB =UniformannualbenefitInitialcost (years) - Conventional method ignores time-value-of-money! - Discounted/Dynamic PB: The length of time required to recover initial cash outlay on the project based on discounted cash-flows (i.e., include time-value-of-money) - Decision criteria: PB shorter than some specified period 3.3 CASH FLOW STATEMENTS The net cash flow from operating activities, investing activities and financing activities for Altemative A and B are identified from the Sydney Train and Sydney Metro Annual Reports. A further break down of the cash flow statement is in Appendix A with assumptions of future costs relayed in Appendix B.3. 3.3.1 OPERATING ACTIVITIES Table =. Alternative A - Cash Flow from Operating Activities Table =. Altemative B - Cash Flow from Operating Activities 3.3.2 INVESTING ACTIVITIES Table =. Alternative A - Cash Flow from Investing Activities Table =. Altemative B - Cash Flow from Investing Activities 3.3.3 FINANCING ACTIVITIES Table =. Altemative A - Cash Flow from Financing Activities Table =. Alternative B - Cash Flow from Financing Activities - calculate all below viability indicators for project alternatives (A \& B) 4.1 NET PRESENT VALUE (NPV) NPV=I0+(BC)PVIFAi,n+LnPVIFi,nNFV=I0FVIFi,n+(BC)FVIFAi,n+Ln 4.2 INTERNAL RATE OF RETURN (IRR) IRR (approximation) IRR=i1NPV1(NPV2NPV1)(i2i1) 4.3 PAYBACK PERIOD (PB) PAYBACK PERIOD (PB) - Conventional/Static PB: The length of time required to recover initial cash outlay on the project - Conventional PB =UniformannualbenefitInitialcost (years) - Conventional method ignores time-value-of-money! - Discounted/Dynamic PB: The length of time required to recover initial cash outlay on the project based on discounted cash-flows (i.e., include time-value-of-money) - Decision criteria: PB shorter than some specified period