

Question
calculate all the following ratios and analysis of 2018 data. 1. Gross Profit margin= gross profit/sales 2. Net profit margin=net profit/sales 3. Return on assets=net
calculate all the following ratios and analysis of 2018 data.
1. Gross Profit margin= gross profit/sales 2. Net profit margin=net profit/sales 3. Return on assets=net profit/average total assets 4. Return on equity= net profit/average equity
5. Current Ratio= current assets/current liabilites 6. Quick Ratio=quick assets/current liabilites 7. Net working capital=current assets-current liabilities 8. Cash Ratio=cash+marketable securities/current liabilites
9. Receivables turnover=Net credit sales/ average accounts receivable 10. Days sales outstanding=365/receivable turnover 11. Inventory turnover=Cost of sales/average inventory 12. Days inventory outstanding=365/inventory turnover 13. Accounts payable turnover=net credit purchases/ average accounts payable 14. Days payable outstanding=365/accounts payable turonver 15. Operating cycle=Days Inv. Out + Days Sales Outs 16. Cash conversion cycle=Operating cycle-Days Payable Outstanding 17. Total Asset trunver=Net sales/total assets
18. Debt ratio=Total Liabilities/total assets 19. Equity ratio=Total equity/total assets 20. Debt-Equity ratio=Total liabilities/total equity 21. Times-Interest earned=EBIT/Interest Expense
22. Earning per share=Net income / common shares outstanding 23. Price Earning ratio=Market price per share / earning per share 24. Dividend payout ratio=Dividend per share/ earning per share 25. Dividend yield ratio=Dividend per share/ market price per share 26. Book value per share=Common equity/average common shares outs.
data:
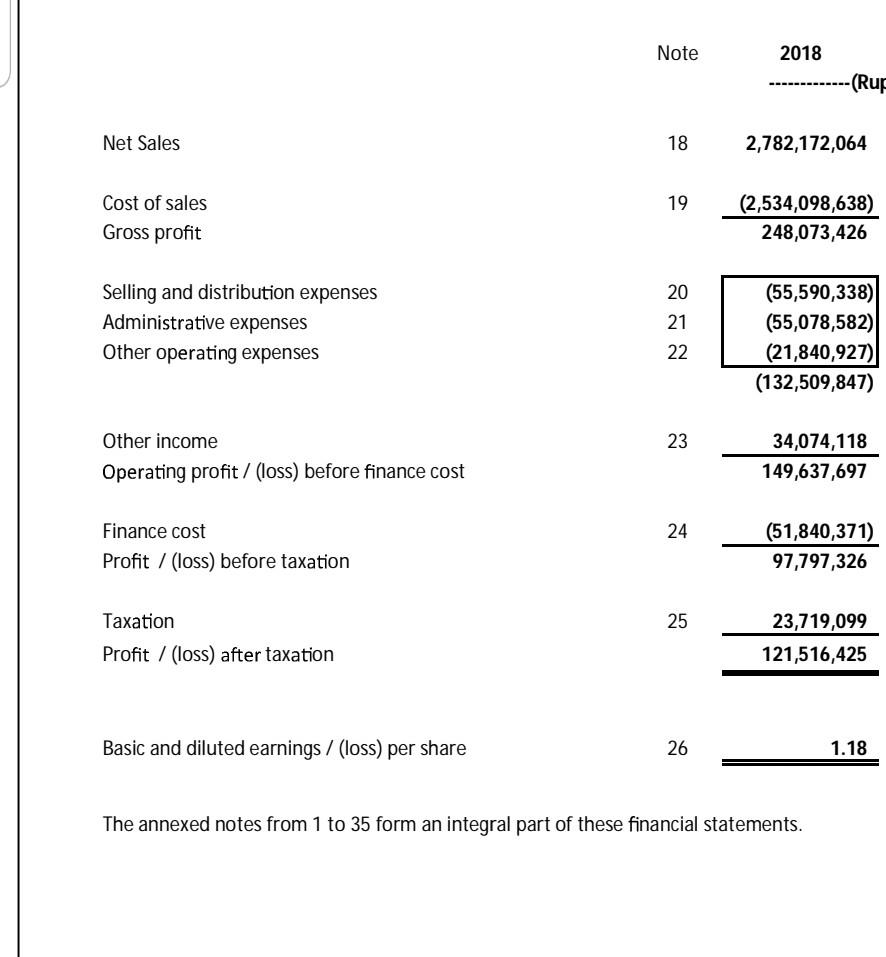
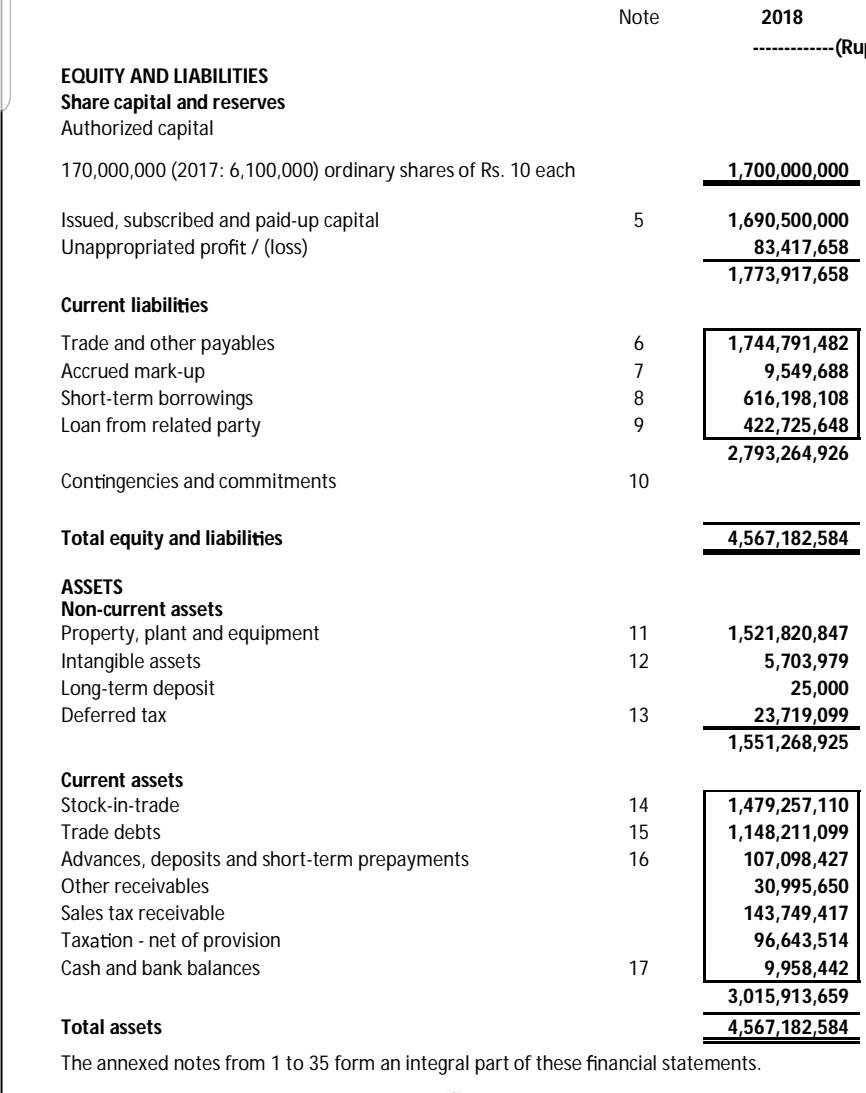
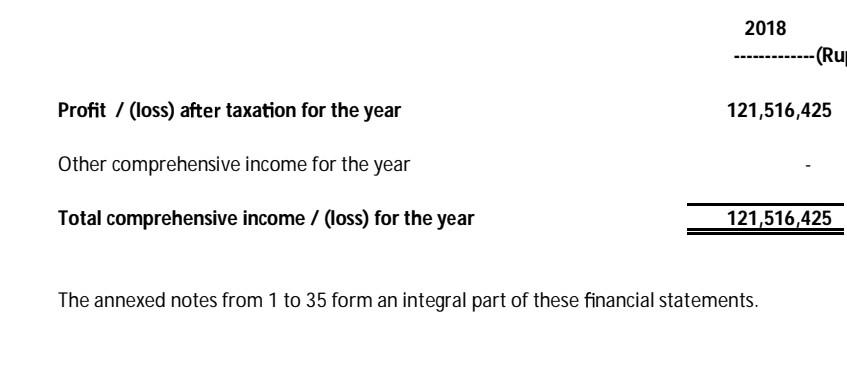
Note 2018 -(Rup Net Sales 18 2,782,172,064 19 Cost of sales Gross profit (2,534,098,638) 248,073,426 20 Selling and distribution expenses Administrative expenses Other operating expenses 21 22 (55,590,338) (55,078,582) (21,840,927) (132,509,847) 23 Other income Operating profit/ (loss) before finance cost 34,074,118 149,637,697 24 Finance cost Profit / (loss) before taxation (51,840,371) 97,797,326 25 Taxation Profit / (loss) after taxation 23,719,099 121,516,425 Basic and diluted earnings / (loss) per share 26 1.18 The annexed notes from 1 to 35 form an integral part of these financial statements. Note 2018 -(Rup EQUITY AND LIABILITIES Share capital and reserves Authorized capital 170,000,000 (2017: 6,100,000) ordinary shares of Rs. 10 each 1,700,000,000 5 Issued, subscribed and paid-up capital Unappropriated profit/ (loss) 1,690,500,000 83,417,658 1,773,917,658 Current liabilities Trade and other payables Accrued mark-up Short-term borrowings Loan from related party 6 7 8 9 1,744,791,482 9,549,688 616,198,108 422,725,648 2,793,264,926 Contingencies and commitments 10 Total equity and liabilities 4,567,182,584 ASSETS Non-current assets Property, plant and equipment Intangible assets Long-term deposit Deferred tax 11 12 1,521,820,847 5,703,979 25,000 23,719,099 1,551,268,925 13 Current assets Stock-in-trade 14 1,479,257,110 Trade debts 15 1,148,211,099 Advances, deposits and short-term prepayments 16 107,098,427 Other receivables 30,995,650 Sales tax receivable 143,749,417 Taxation - net of provision 96,643,514 Cash and bank balances 17 9,958,442 3,015,913,659 Total assets 4,567,182,584 The annexed notes from 1 to 35 form an integral part of these financial statements. 2018 -(Rus Profit / (loss) after taxation for the year 121,516,425 Other comprehensive income for the year Total comprehensive income / (loss) for the year 121,516,425 The annexed notes from 1 to 35 form an integral part of these financial statements. Note 2018 -(Rup Net Sales 18 2,782,172,064 19 Cost of sales Gross profit (2,534,098,638) 248,073,426 20 Selling and distribution expenses Administrative expenses Other operating expenses 21 22 (55,590,338) (55,078,582) (21,840,927) (132,509,847) 23 Other income Operating profit/ (loss) before finance cost 34,074,118 149,637,697 24 Finance cost Profit / (loss) before taxation (51,840,371) 97,797,326 25 Taxation Profit / (loss) after taxation 23,719,099 121,516,425 Basic and diluted earnings / (loss) per share 26 1.18 The annexed notes from 1 to 35 form an integral part of these financial statements. Note 2018 -(Rup EQUITY AND LIABILITIES Share capital and reserves Authorized capital 170,000,000 (2017: 6,100,000) ordinary shares of Rs. 10 each 1,700,000,000 5 Issued, subscribed and paid-up capital Unappropriated profit/ (loss) 1,690,500,000 83,417,658 1,773,917,658 Current liabilities Trade and other payables Accrued mark-up Short-term borrowings Loan from related party 6 7 8 9 1,744,791,482 9,549,688 616,198,108 422,725,648 2,793,264,926 Contingencies and commitments 10 Total equity and liabilities 4,567,182,584 ASSETS Non-current assets Property, plant and equipment Intangible assets Long-term deposit Deferred tax 11 12 1,521,820,847 5,703,979 25,000 23,719,099 1,551,268,925 13 Current assets Stock-in-trade 14 1,479,257,110 Trade debts 15 1,148,211,099 Advances, deposits and short-term prepayments 16 107,098,427 Other receivables 30,995,650 Sales tax receivable 143,749,417 Taxation - net of provision 96,643,514 Cash and bank balances 17 9,958,442 3,015,913,659 Total assets 4,567,182,584 The annexed notes from 1 to 35 form an integral part of these financial statements. 2018 -(Rus Profit / (loss) after taxation for the year 121,516,425 Other comprehensive income for the year Total comprehensive income / (loss) for the year 121,516,425 The annexed notes from 1 to 35 form an integral part of these financial statements
Step by Step Solution
There are 3 Steps involved in it
Step: 1

Get Instant Access to Expert-Tailored Solutions
See step-by-step solutions with expert insights and AI powered tools for academic success
Step: 2

Step: 3
Ace Your Homework with AI
Get the answers you need in no time with our AI-driven, step-by-step assistance
Get Started
Quality Management Audits In Nuclear Medicine Practices
Authors: International Atomic Energy Agency (IAEA)
1st Edition
9201121083, 978-9201121080