Answered step by step
Verified Expert Solution
Question
1 Approved Answer
Calculate in the year 2019: a. Return on Equity(ROE) Ratio b. DuPont-Return on Asset Ratio c. Debt to Equity Ratio d. Liquidity Ratio AS AT

 Calculate in the year 2019:
a. Return on Equity(ROE) Ratio
b. DuPont-Return on Asset Ratio
c. Debt to Equity Ratio
d. Liquidity Ratio
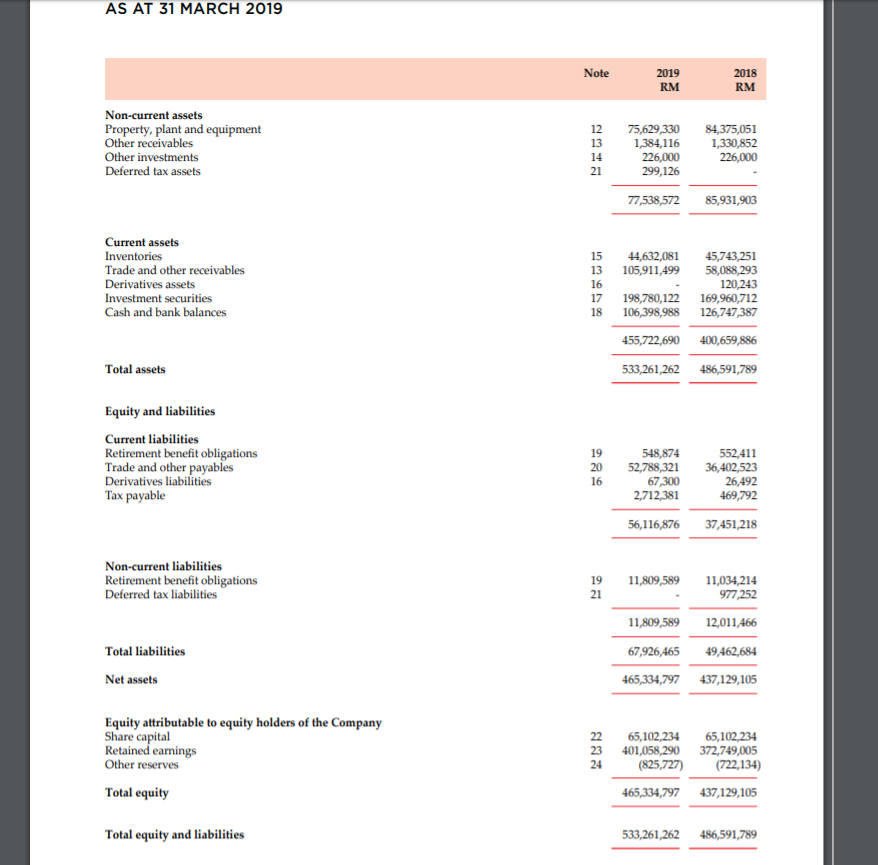
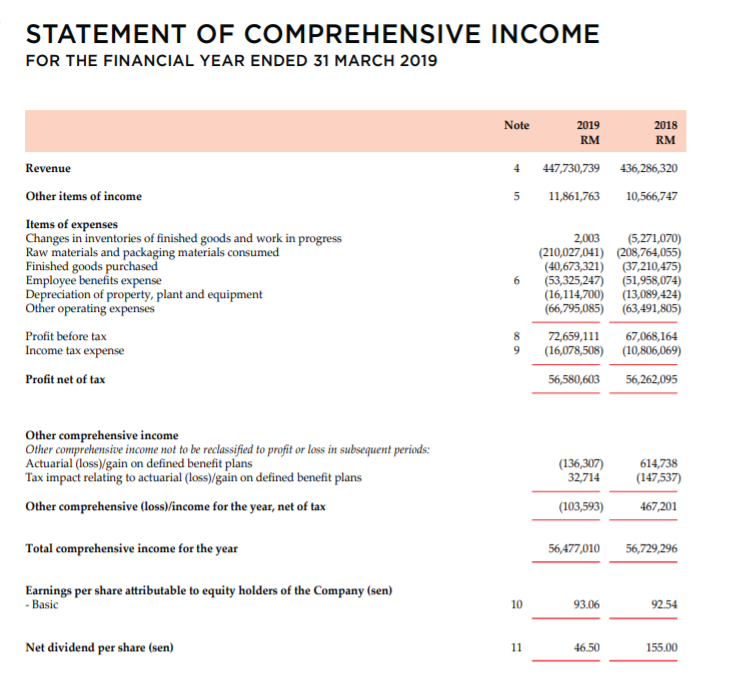
AS AT 31 MARCH 2019 Note 2019 RM 2018 RM 12 Non-current assets Property, plant and equipment Other receivables Other investments Deferred tax assets 75,629,330 1,384,116 226,000 299,126 84,375,051 1,330,852 226,000 77,538,572 85,931,903 15 44,632,081 105,911,499 Current assets Inventories Trade and other receivables Derivatives assets Investment securities Cash and bank balances 16 45,743,251 58,088,293 120,243 169,960,712 126,747,387 18 198,780,122 106,398,988 455,722,690 400,659,886 Total assets 533,261,262 486,591,789 Equity and liabilities Current liabilities Retirement benefit obligations Trade and other payables Derivatives liabilities Tax payable 548,874 52,788,321 67 300 2,712,381 552,411 36,402.523 26,492 469,792 56,116,876 37,451,218 Non-current liabilities Retirement benefit obligations Deferred tax liabilities 19 11,809,589 11,034,214 977,252 11,809,589 12,011,466 Total liabilities 67,926,465 49,462,684 Net assets 465,334,797 437,129,105 Equity attributable to equity holders of the Company Share capital Retained earnings Other reserves 22 23 65,102,234 401,058,290 (825,727) 65,102,234 372,749,005 (722,134) Total equity 465,334,797437,129,105 Total equity and liabilities 533,261,262 486,591,789 STATEMENT OF COMPREHENSIVE INCOME FOR THE FINANCIAL YEAR ENDED 31 MARCH 2019 Note 2019 2018 RM RM Revenue 4 447,730,739 436,286,320 Other items of income 5 11,861,763 10,566,747 Items of expenses Changes in inventories of finished goods and work in progress Raw materials and packaging materials consumed Finished goods purchased Employee benefits expense Depreciation of property, plant and equipment Other operating expenses 2,003 (5,271,070) (210,027,041) (208,764,055) (40,673,321) (37,210,475) (53,325,247) (51,958,074) (16,114,700) (13,089,424) (66,795,085) (63,491,805) 6 (533 8 Profit before tax Income tax expense 72,659,111 (16,078,508) 67,068,164 (10,806,069) 9 Profit net of tax 56,580,603 56,262,095 Other comprehensive income Other comprehensive income not to be reclassified to profit or loss in subsequent periods: Actuarial (lossgain on defined benefit plans Tax impact relating to actuarial (loss)/gain on defined benefit plans (136,307) 32,714 614,738 (147,537) Other comprehensive (loss)/income for the year, net of tax (103,593) 467,201 Total comprehensive income for the year 56,477,010 56,729,296 Earnings per share attributable to equity holders of the Company (sen) - Basic 10 93.06 92.54 Net dividend per share (sen) 11 46.50 155.00Step by Step Solution
There are 3 Steps involved in it
Step: 1

Get Instant Access to Expert-Tailored Solutions
See step-by-step solutions with expert insights and AI powered tools for academic success
Step: 2

Step: 3

Ace Your Homework with AI
Get the answers you need in no time with our AI-driven, step-by-step assistance
Get Started


