Question
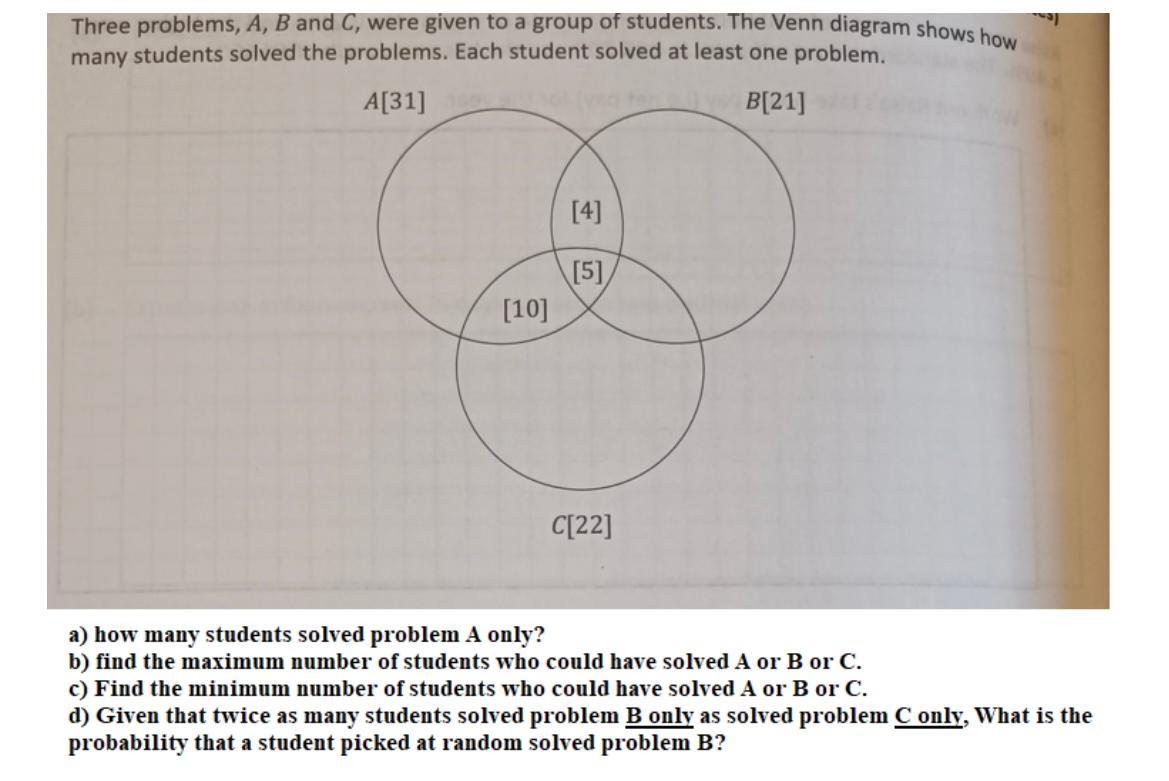
Three problems, A, B and C, were given to a group of students. The Venn diagram shows how many students solved the problems. Each

Three problems, A, B and C, were given to a group of students. The Venn diagram shows how many students solved the problems. Each student solved at least one problem. A[31] det Ten youB[21] [10] [4] [5] C[22] a) how many students solved problem A only? b) find the maximum number of students who could have solved A or B or C. c) Find the minimum number of students who could have solved A or B or C. d) Given that twice as many students solved problem B only as solved problem C only, What is the probability that a student picked at random solved problem B?
Step by Step Solution
3.50 Rating (160 Votes )
There are 3 Steps involved in it
Step: 1

Get Instant Access to Expert-Tailored Solutions
See step-by-step solutions with expert insights and AI powered tools for academic success
Step: 2

Step: 3

Ace Your Homework with AI
Get the answers you need in no time with our AI-driven, step-by-step assistance
Get StartedRecommended Textbook for
Understanding Basic Statistics
Authors: Charles Henry Brase, Corrinne Pellillo Brase
6th Edition
978-1133525097, 1133525091, 1111827028, 978-1133110316, 1133110312, 978-1111827021
Students also viewed these Accounting questions
Question
Answered: 1 week ago
Question
Answered: 1 week ago
Question
Answered: 1 week ago
Question
Answered: 1 week ago
Question
Answered: 1 week ago
Question
Answered: 1 week ago
Question
Answered: 1 week ago
Question
Answered: 1 week ago
Question
Answered: 1 week ago
Question
Answered: 1 week ago
Question
Answered: 1 week ago
Question
Answered: 1 week ago
Question
Answered: 1 week ago
Question
Answered: 1 week ago
Question
Answered: 1 week ago
Question
Answered: 1 week ago
Question
Answered: 1 week ago
Question
Answered: 1 week ago
Question
Answered: 1 week ago
Question
Answered: 1 week ago
Question
Answered: 1 week ago
Question
Answered: 1 week ago
Question
Answered: 1 week ago
Question
Answered: 1 week ago
View Answer in SolutionInn App


