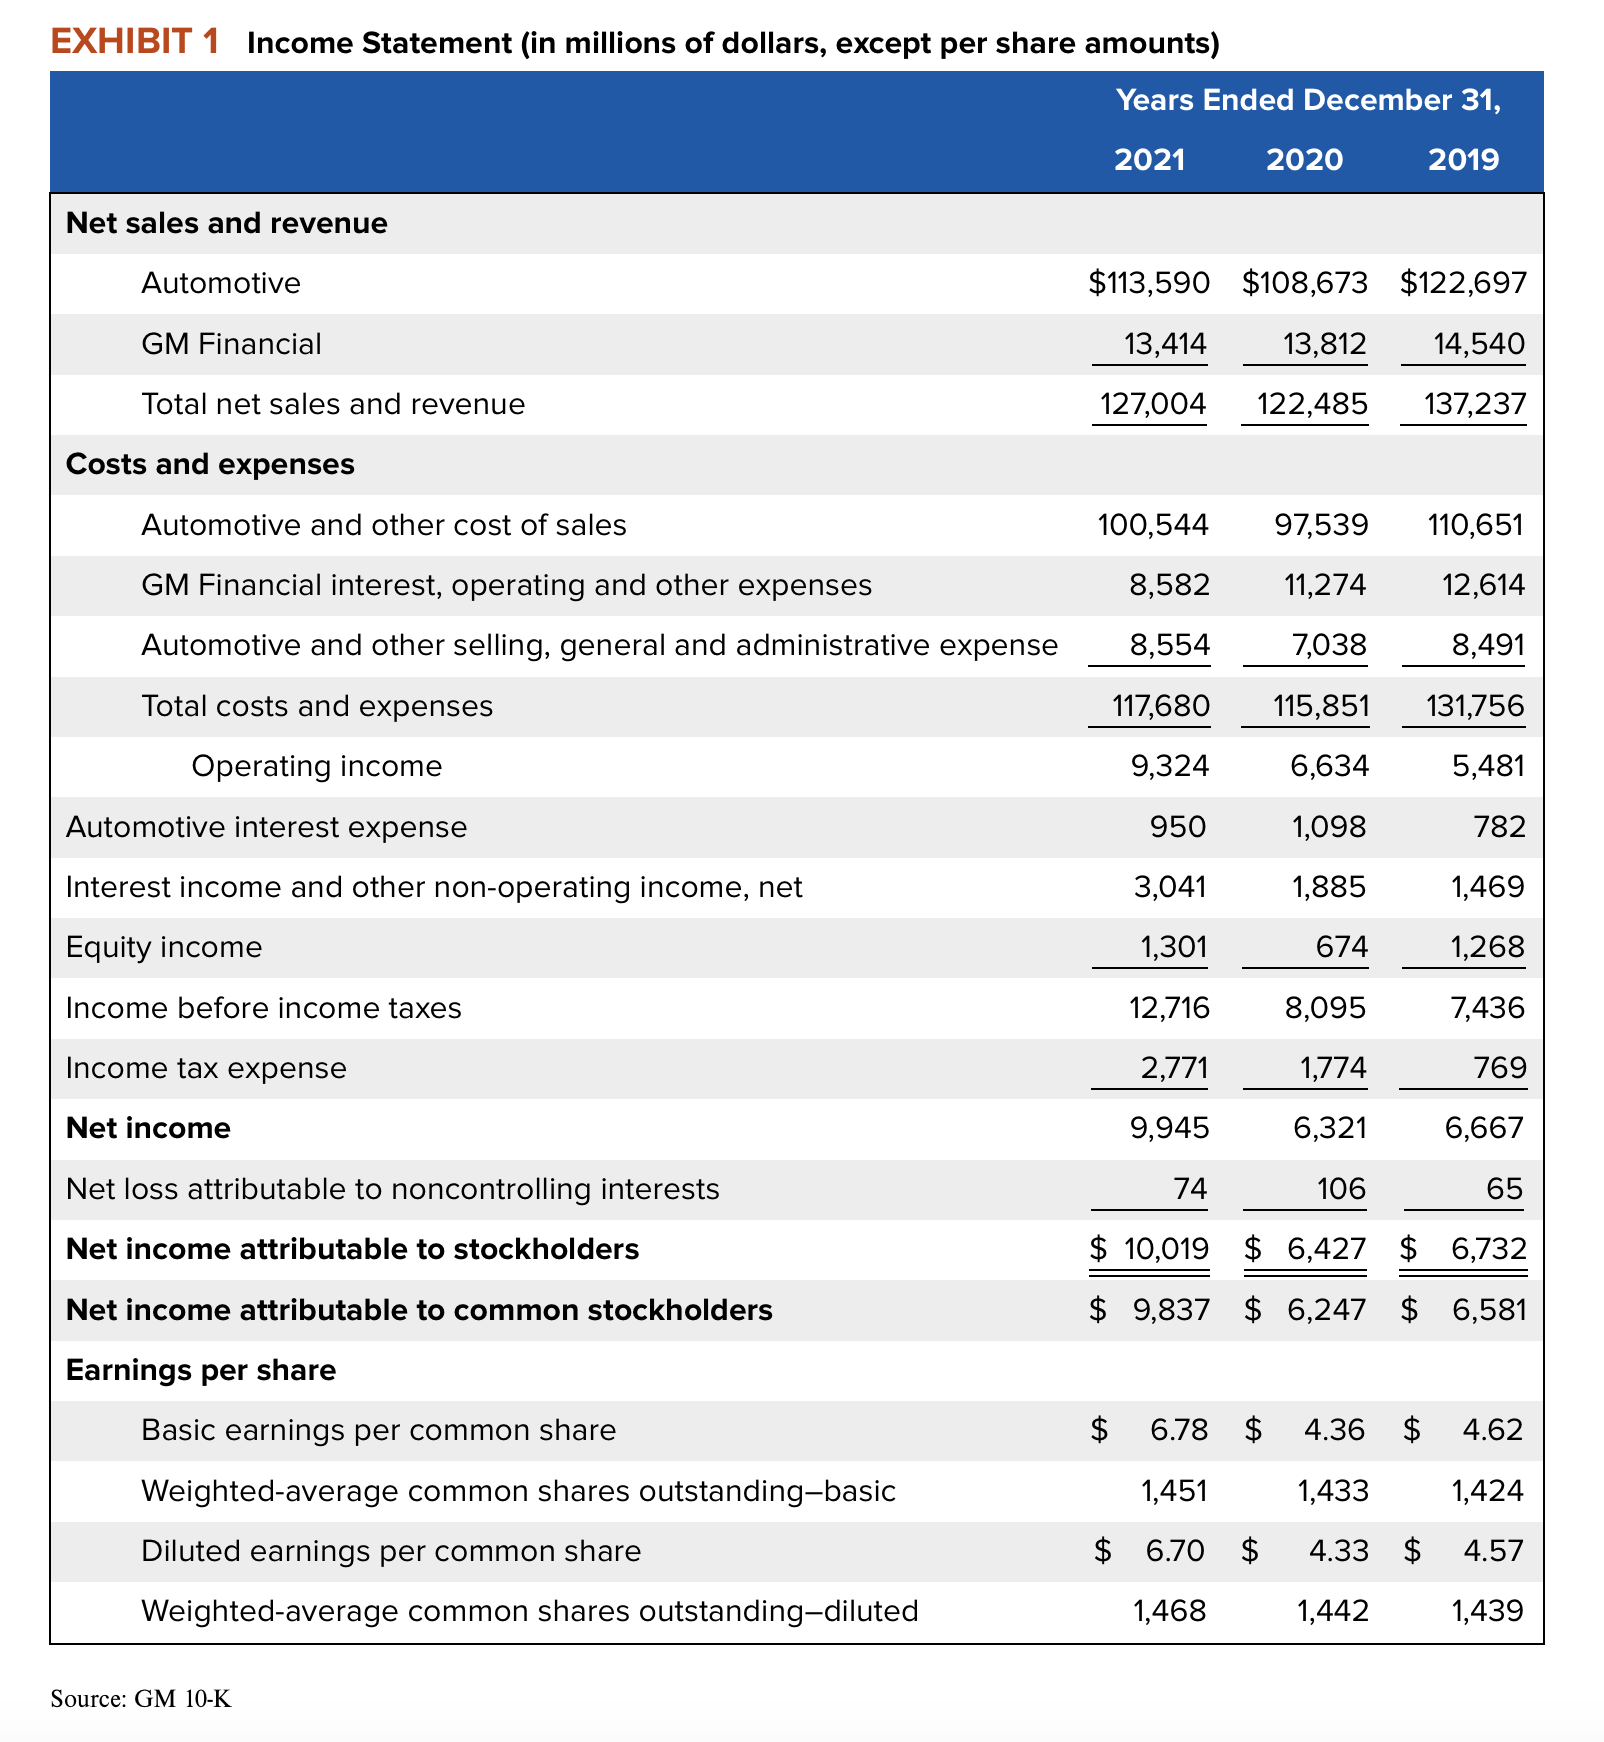
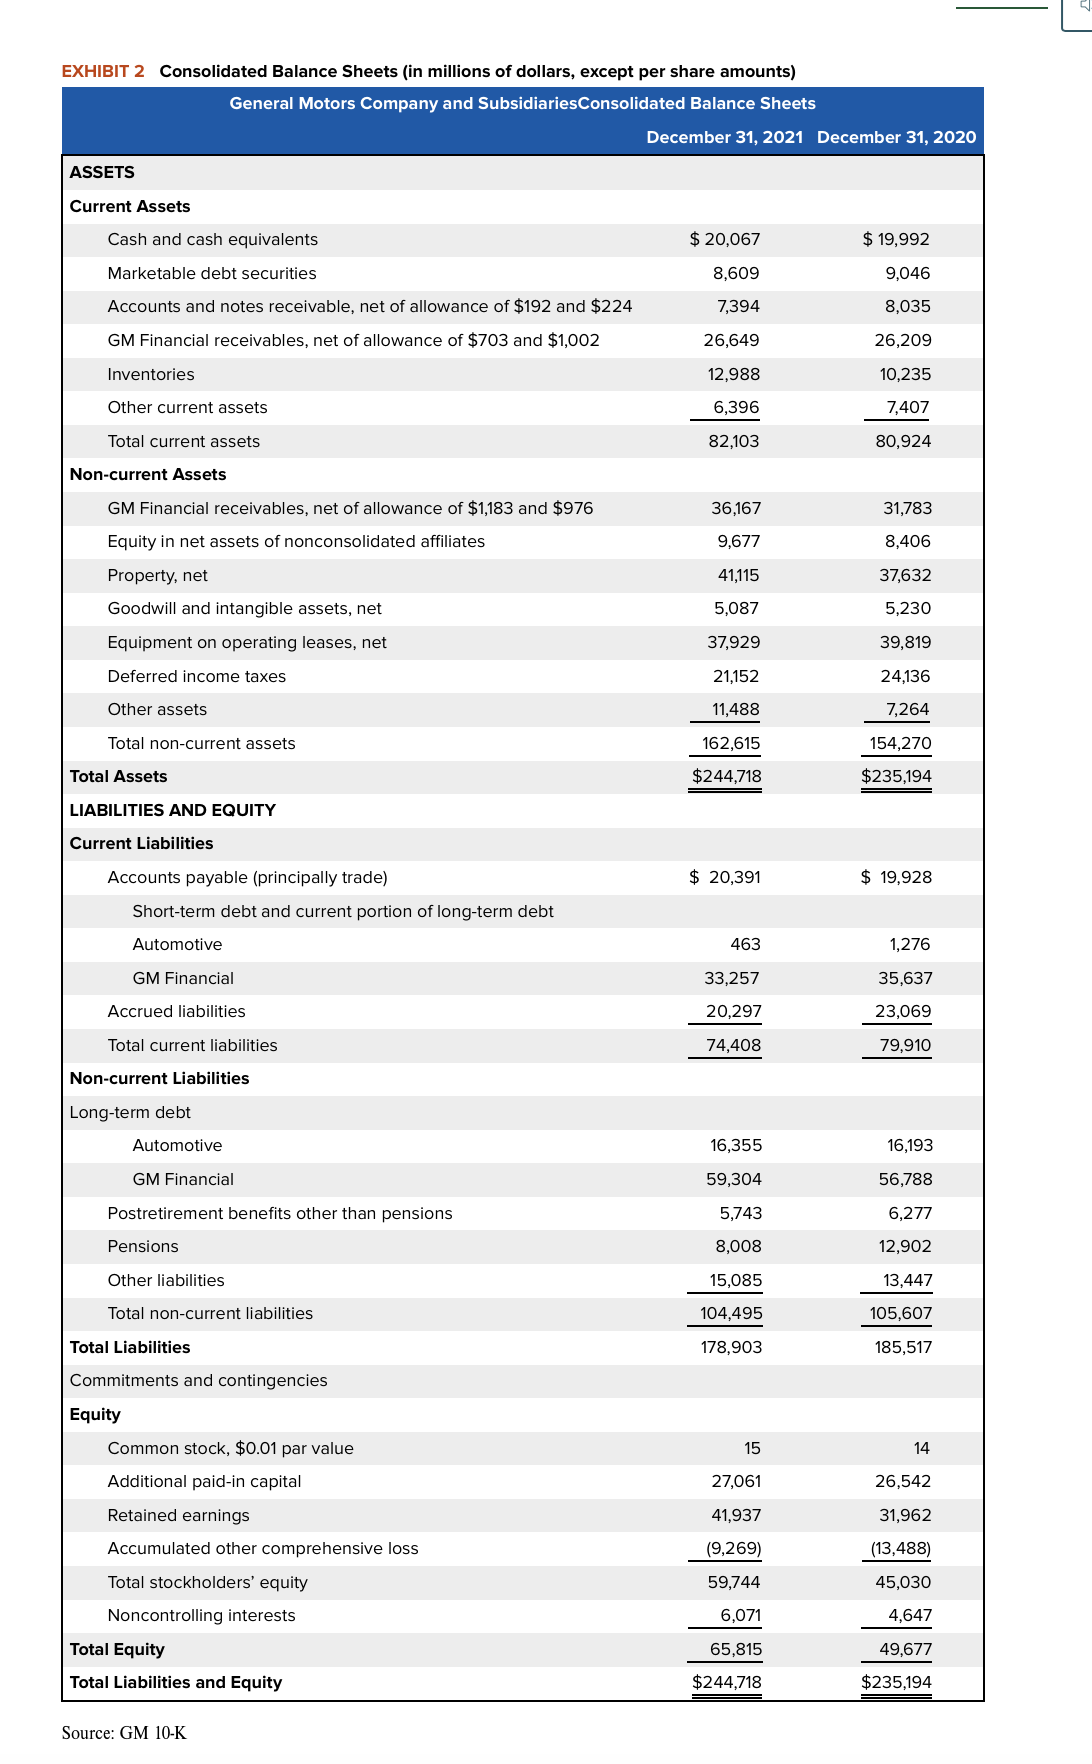
Calculate percentage change for the items in the table below extracted from the case exhibits. Calculate 2020 and 2021 and round all numbers up


Calculate percentage change for the items in the table below extracted from the case exhibits. Calculate 2020 and 2021 and round all numbers up to the nearest hundredth. For example, answers should look like -.05 or 1.33. ROA ROE Current Ratio Debt to Equity 2021 % % % % 2020 % % % % EXHIBIT 1 Income Statement (in millions of dollars, except per share amounts) Net sales and revenue Automotive GM Financial Total net sales and revenue Costs and expenses Automotive and other cost of sales GM Financial interest, operating and other expenses Automotive and other selling, general and administrative expense Total costs and expenses Operating income Automotive interest expense Interest income and other non-operating income, net Equity income Income before income taxes Income tax expense Net income Net loss attributable to noncontrolling interests Net income attributable to stockholders Net income attributable to common stockholders Earnings per share Basic earnings per common share Weighted-average common shares outstanding-basic Diluted earnings per common share Weighted-average common shares outstanding-diluted Source: GM 10-K Years Ended December 31, 2021 2019 2020 $113,590 $108,673 $122,697 13,414 13,812 14,540 127,004 122,485 137,237 100,544 97,539 8,582 11,274 8,554 7,038 117,680 115,851 9,324 6,634 950 1,098 3,041 1,885 1,301 674 12,716 2,771 9,945 74 110,651 12,614 8,491 131,756 5,481 782 1,469 1,268 8,095 7,436 1,774 769 6,321 6,667 106 65 $10,019 $ 6,427 $ 6,732 $9,837 $ 6,247 $ 6,581 $ 6.78 $ 4.36 $ 4.62 1,451 1,433 1,424 $6.70 $ 4.33 $ 4.57 1,468 1,439 1,442 EXHIBIT 2 Consolidated Balance Sheets (in millions of dollars, except per share amounts) General Motors Company and Subsidiaries Consolidated Balance Sheets ASSETS Current Assets Cash and cash equivalents Marketable debt securities Accounts and notes receivable, net of allowance of $192 and $224 GM Financial receivables, net of allowance of $703 and $1,002 Inventories Other current assets Total current assets Non-current Assets GM Financial receivables, net of allowance of $1,183 and $976 Equity in net assets of nonconsolidated affiliates Property, net Goodwill and intangible assets, net Equipment on operating leases, net Deferred income taxes Other assets Total non-current assets Total Assets LIABILITIES AND EQUITY Current Liabilities Accounts payable (principally trade) Short-term debt and current portion of long-term debt Automotive GM Financial Accrued liabilities Total current liabilities Non-current Liabilities Long-term debt Automotive GM Financial Postretirement benefits other than pensions Pensions Other liabilities Total non-current liabilities Total Liabilities Commitments and contingencies Equity Common stock, $0.01 par value Additional paid-in capital Retained earnings Accumulated other comprehensive loss Total stockholders' equity Noncontrolling interests Total Equity Total Liabilities and Equity Source: GM 10-K December 31, 2021 December 31, 2020 $ 20,067 8,609 7,394 26,649 12,988 6,396 82,103 36,167 9,677 41,115 5,087 37,929 21,152 11,488 162,615 $244,718 $20,391 463 33,257 20,297 74,408 16,355 59,304 5,743 8,008 15,085 104,495 178,903 15 27,061 41,937 (9,269) 59,744 6,071 65,815 $244,718 $ 19,992 9,046 8,035 26,209 10,235 7,407 80,924 31,783 8,406 37,632 5,230 39,819 24,136 7,264 154,270 $235,194 $ 19,928 1,276 35,637 23,069 79,910 16,193 56,788 6,277 12,902 13,447 105,607 185,517 14 26,542 31,962 (13,488) 45,030 4,647 49,677 $235,194
Step by Step Solution
3.41 Rating (154 Votes )
There are 3 Steps involved in it
Step: 1
Particulars 2021 2020 ROA 443 269 ROE 1665 1404 Current Ratio 110 101 Debt to Equity 2...
See step-by-step solutions with expert insights and AI powered tools for academic success
Step: 2

Step: 3

Ace Your Homework with AI
Get the answers you need in no time with our AI-driven, step-by-step assistance
Get Started


