Answered step by step
Verified Expert Solution
Link Copied!

Question

1 Approved Answer

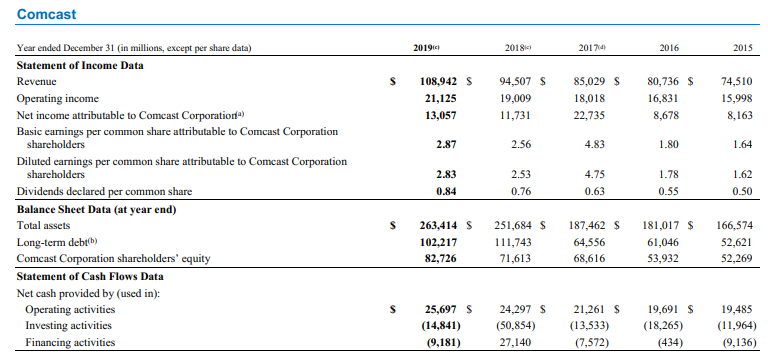
Calculate the company's sales and profit growth rates for the past three years Comcast 2019 2018 2017) 2016 2015 108,942 S 21,125 13,057 94,507 $

Calculate the company's sales and profit growth rates for the past three years

image text in transcribed

Comcast 2019 2018 2017) 2016 2015 108,942 S 21,125 13,057 94,507 $ 19,009 11,731 85,029 $ 18,018 22,735 80,736 $ 16,831 8,678 74,510 15,998 8,163 2.87 2.56 4.83 1.80 1.64 2.83 0.84 2.53 0.76 4.75 0.63 Year ended December 31 (in millions, except per share data) Statement of Income Data Revenue Operating income Net income attributable to Comcast Corporation) Basic earnings per common share attributable to Comcast Corporation shareholders Diluted earnings per common share attributable to Comcast Corporation shareholders Dividends declared per common share Balance Sheet Data (at year end) Total assets Long-term debtb) Comcast Corporation shareholders' equity Statement of Cash Flows Data Net cash provided by (used in): Operating activities Investing activities Financing activities 1.78 0.55 1.62 0.50 263,414 $ 102,217 82,726 251,684 $ 111,743 71,613 187,462 $ 64,556 68,616 181,017 $ 61,046 53,932 166,574 52,621 52.269 25,697 $ (14,841) (9,181) 24,297 $ (50,854) 27,140 21,261 $ (13,533) (7,572) 19,691 $ (18,265) (434) 19,485 (11,964) (9,136)

Step by Step Solution

There are 3 Steps involved in it

Step: 1

blur-text-image

Get Instant Access to Expert-Tailored Solutions

See step-by-step solutions with expert insights and AI powered tools for academic success

Step: 2

blur-text-image

Step: 3

blur-text-image

Ace Your Homework with AI

Get the answers you need in no time with our AI-driven, step-by-step assistance

Get Started

Recommended Textbook for

Forensic Accounting And Financial Statement Fraud Forensic Accounting Performance

Authors: Zabihollah Rezaee

1st Edition

1949991075, 978-1949991079

More Books

Students also viewed these Accounting questions