

Answered step by step
Verified Expert Solution
Question
1 Approved Answer
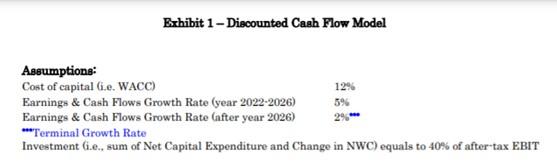
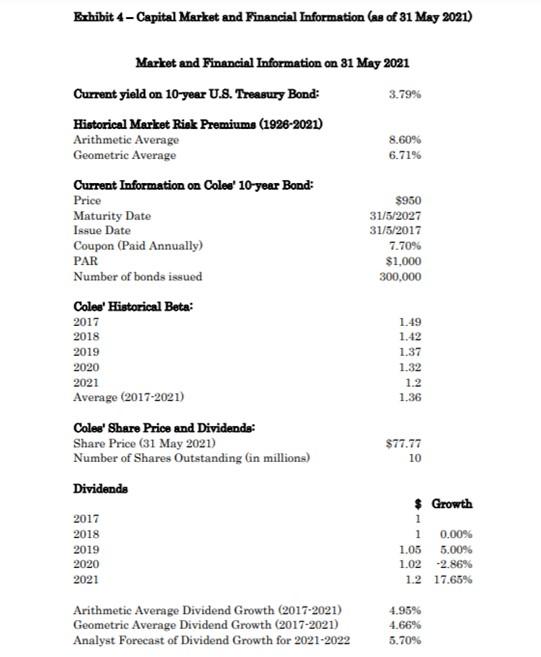
Calculate the DCF using the assumption above (recalculate the WACC rate using exhibit 4) and determine the equity value per share based on the DCF
Calculate the DCF using the assumption above (recalculate the WACC rate using exhibit 4) and determine the equity value per share based on the DCF
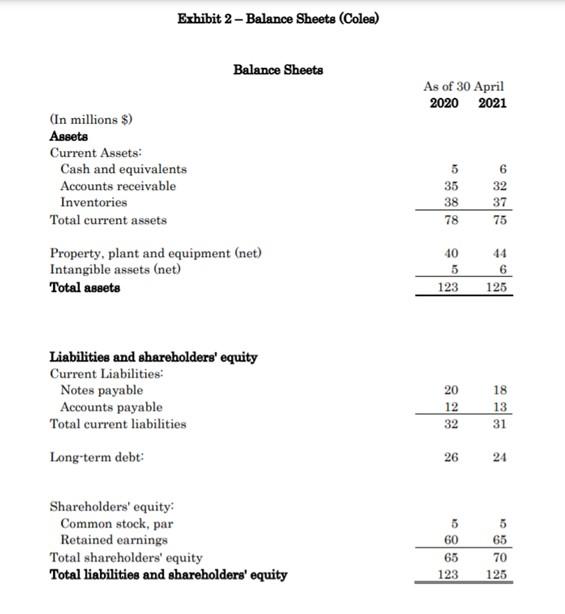
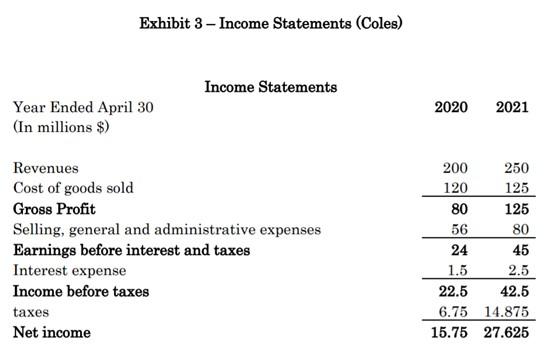
Exhibit 1 - Discounted Cash Flow Model Assumptions: Cost of capital G.. WACC) 12% Earnings & Cash Flows Growth Rate (year 2022-2026) 5% Earnings & Cash Flows Growth Rate (after year 2026) ***Terminal Growth Rate Investment (i.e., sum of Net Capital Expenditure and Change in NWC) equals to 40% of after-tax EBIT Exhibit 2- Balance Sheets (Coles) Balance Sheets As of 30 April 2020 2021 (In millions $) Assets Current Assets: Cash and equivalents Accounts receivable Inventories Total current assets 5 35 38 78 6 32 37 75 Property, plant and equipment (net) Intangible assets (net) Total assets 40 5 6 123 125 Liabilities and shareholders' equity Current Liabilities: Notes payable Accounts payable Total current liabilities 20 12 32 18 13 31 Long-term debt: 26 24 Shareholders' equity Common stock, par Retained earnings Total shareholders' equity Total liabilities and shareholders' equity 5 60 65 123 65 70 125 Exhibit 3 - Income Statements (Coles) Income Statements 2020 2021 Year Ended April 30 (In millions $) 200 120 80 Revenues Cost of goods sold Gross Profit Selling, general and administrative expenses Earnings before interest and taxes Interest expense Income before taxes taxes Net income 250 125 125 56 80 45 1.5 2.5 22.5 42.5 6.75 14.875 15.75 27.625 24 Bxhibit 4 - Capital Market and Financial Information (as of 31 May 2021) Market and Financial Information on 31 May 2021 Current yield on 10-year U.S. Treasury Bond: 3.79% Historical Market Risk Premiums (1926-2021) Arithmetic Average 8.60% Geometric Average 6.71% Current Information on Coles' 10-year Bond: Price $950 Maturity Date 31/5/2027 Issue Date 31/5/2017 Coupon (Paid Annually) 7.70% PAR $1,000 Number of bonds issued 300,000 Coles' Historical Beta: 2017 1.49 2018 1.42 2019 1.37 2020 1.32 2021 Average (2017-2021) 1.36 Coles' Share Price and Dividends: Share Price (31 May 2021) $77.77 Number of Shares Outstanding in millions) 1.2 10 Dividends 2017 2018 2019 2020 2021 $ Growth 1 1 0.00% 1.05 5.00% 1.02 2.86% 1.2 17.65% Arithmetic Average Dividend Growth (2017-2021) Geometric Average Dividend Growth (2017-2021) Analyst Forecast of Dividend Growth for 2021-2022 4.95% 4.66% 5.70% Exhibit 1 - Discounted Cash Flow Model Assumptions: Cost of capital G.. WACC) 12% Earnings & Cash Flows Growth Rate (year 2022-2026) 5% Earnings & Cash Flows Growth Rate (after year 2026) ***Terminal Growth Rate Investment (i.e., sum of Net Capital Expenditure and Change in NWC) equals to 40% of after-tax EBIT Exhibit 2- Balance Sheets (Coles) Balance Sheets As of 30 April 2020 2021 (In millions $) Assets Current Assets: Cash and equivalents Accounts receivable Inventories Total current assets 5 35 38 78 6 32 37 75 Property, plant and equipment (net) Intangible assets (net) Total assets 40 5 6 123 125 Liabilities and shareholders' equity Current Liabilities: Notes payable Accounts payable Total current liabilities 20 12 32 18 13 31 Long-term debt: 26 24 Shareholders' equity Common stock, par Retained earnings Total shareholders' equity Total liabilities and shareholders' equity 5 60 65 123 65 70 125 Exhibit 3 - Income Statements (Coles) Income Statements 2020 2021 Year Ended April 30 (In millions $) 200 120 80 Revenues Cost of goods sold Gross Profit Selling, general and administrative expenses Earnings before interest and taxes Interest expense Income before taxes taxes Net income 250 125 125 56 80 45 1.5 2.5 22.5 42.5 6.75 14.875 15.75 27.625 24 Bxhibit 4 - Capital Market and Financial Information (as of 31 May 2021) Market and Financial Information on 31 May 2021 Current yield on 10-year U.S. Treasury Bond: 3.79% Historical Market Risk Premiums (1926-2021) Arithmetic Average 8.60% Geometric Average 6.71% Current Information on Coles' 10-year Bond: Price $950 Maturity Date 31/5/2027 Issue Date 31/5/2017 Coupon (Paid Annually) 7.70% PAR $1,000 Number of bonds issued 300,000 Coles' Historical Beta: 2017 1.49 2018 1.42 2019 1.37 2020 1.32 2021 Average (2017-2021) 1.36 Coles' Share Price and Dividends: Share Price (31 May 2021) $77.77 Number of Shares Outstanding in millions) 1.2 10 Dividends 2017 2018 2019 2020 2021 $ Growth 1 1 0.00% 1.05 5.00% 1.02 2.86% 1.2 17.65% Arithmetic Average Dividend Growth (2017-2021) Geometric Average Dividend Growth (2017-2021) Analyst Forecast of Dividend Growth for 2021-2022 4.95% 4.66% 5.70%Step by Step Solution
There are 3 Steps involved in it
Step: 1

Get Instant Access to Expert-Tailored Solutions
See step-by-step solutions with expert insights and AI powered tools for academic success
Step: 2

Step: 3
Ace Your Homework with AI
Get the answers you need in no time with our AI-driven, step-by-step assistance
Get Started
Global Finance And Development
Authors: David Hudson
1st Edition
0415436354, 978-0415436359