Answered step by step
Verified Expert Solution
Question
1 Approved Answer
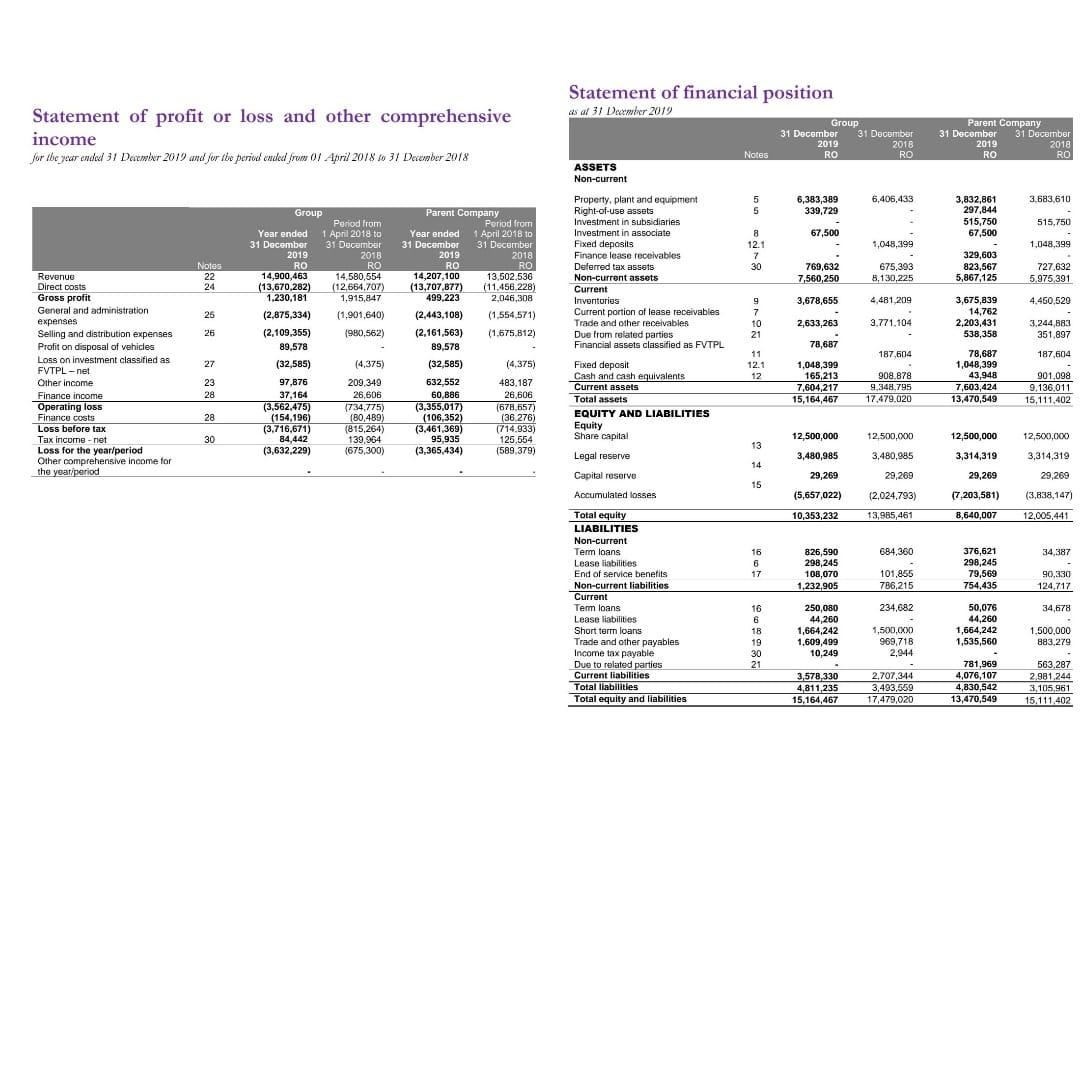
Calculate the following ratios 1-Current Ratio 2-Quick Ratio 3-Cash Ratio 4-Receivables Turnover 5-Inventory Turnover 6-Payables Turnover 7-Debt-Equity Ratio 8-Debt Ratio 9-Total Asset Turnover 10-Fixed Asset
Calculate the following ratios
1-Current Ratio
2-Quick Ratio
3-Cash Ratio
4-Receivables Turnover
5-Inventory Turnover
6-Payables Turnover
7-Debt-Equity Ratio
8-Debt Ratio
9-Total Asset Turnover
10-Fixed Asset Turnover
11-Equity Turnover
12-Gross Profit Margin
13-Operating Profit Margin
14-Net Profit Margin
15-ROA
16- ROE

Statement of profit or loss and other comprehensive income for the year ended 31 December 2019 and for the period ended from 01 April 2018 to 31 December 2018 Revenue Direct costs Gross profit General and administration. expenses Selling and distribution expenses Profit on disposal of vehicles Loss on investment classified as FVTPL - not Other income Finance income Operating loss Finance costs Loss before tax Tax income-not Loss for the year/period Other comprehensive income for the year period Notes 22 24 25 26 27 23 28 28 30 Group Year ended 31 December 2019 RO 14.900.463 (13,670,282) 1,230,181 (2,875,334) (2,109,355) 89,578 (32,585) 97,876 37,164 (3,562,475) (154,196) (3,716,671) 84,442 (3,632,229) Period from 1 April 2018 to 31 December 2018 RO 14,580,554 (12,664,707) 1,915,847 (1,901,640) (980,562) (4,375) 209,349 26,606 (734,775) (80,489) (815,264) 139,964 (675,300) Parent Company Period from Year ended 1 April 2018 to 31 December 31 December 2019 2018 RO RO 14,207,100 13,502,536 (13,707,877) (11,456,228) 499,223 2,046,308 (2,443,108) (1,554,571) (1.675.812) (2,161,563) 89,578 (32,585) 632,552 60,886 (3,355,017) (106,352) (3,461,369) 95,935 (3,365,434) (4,375) 483,187 26,606 (678,657) (36.276) (714.933) 125,554 (589,379) Statement of financial position as at 31 December 2019 ASSETS Non-current Property, plant and equipment Right-of-use assets Investment in subsidiaries Investment in associate Fixed deposits Finance lease receivables Deferred tax assets Non-current assets Current Inventories Current portion of lease receivables Trade and other receivables Due from related parties Financial assets classified as FVTPL Fixed deposit Cash and cash equivalents Current assets Total assets EQUITY AND LIABILITIES Equity Share capital. Legal reserve. Capital reserve. Accumulated losses Total equity LIABILITIES Non-current Term loans Lease liabilities out of End of service benefits Non-current liabilities Current Term loans Lease liabilities Short term loans Trade and other payables Income tax payable Due to related parties Current liabilities LE Total liabilities Total equity and liabilities Notes 5 5 8 12.1 7 30 9 7 10 21 11 12.1 12 13 14 15 16 6 17 16 6 18 19 30 21 Group 31 December 31 December 2018 RO 2019 RO 6,383,389 339,729 67,500 769,632 7,560,250 3,678,655 2,633,263 78,687 w 1,048,399 165,213 7,604,217 15,164,467 12,500,000 3,480,985 29,269 (5,657,022) 10,353,232 826,590 298,245 108,070 1,232,905 250,080 44,260 1,664,242 1,609,499 10,249 3,578,330 4,811,235 15,164,467 6,406,433 1,048,399 675,393 8,130,225 4,481,209 3,771,104 187,604 . 908.878 9,348,795 17,479,020 12,500,000 3,480,985 29,269 (2,024,793) 13,985,461 684,360 101,855 786,215 234,682 1,500,000 969,718 2,944 2,707,344 3,493,559 17,479,020 Parent Company 31 December 31 December 2019 RO 3,832,861 297,844 515,750 67,500 329,603 823,567 5,867,125 14,762 3,675,839 2,203,431 538,358 78,687 1,048,399 43,948 7,603,424 13,470,549 12,500,000 3,314,319 29,269 (7,203,581) 8,640,007 376,621 298,245 79,569 754,435 50,076 44,260 1,664,242 1,535,560 781,969 4,076,107 4.830.542 13,470,549 2018 RO 3,683,610 515,750 1,048.399 727,632 5.975.391 4,450,529 3,244,883 351,897 187,604 901,098 9,136,011 15,111,402 12,500,000 3,314,319 29,269 (3,838,147) 12,005,441 34,387 90,330 124,717 34,678 1,500,000 883,279 563.287 2,981,244 3,105,961 15,111,402
Step by Step Solution
★★★★★
3.39 Rating (152 Votes )
There are 3 Steps involved in it
Step: 1
Here are the calculations for the ratios 1 Current Ratio Current Assets Current Liabilities 7604217 ...
Get Instant Access to Expert-Tailored Solutions
See step-by-step solutions with expert insights and AI powered tools for academic success
Step: 2

Step: 3

Ace Your Homework with AI
Get the answers you need in no time with our AI-driven, step-by-step assistance
Get Started


