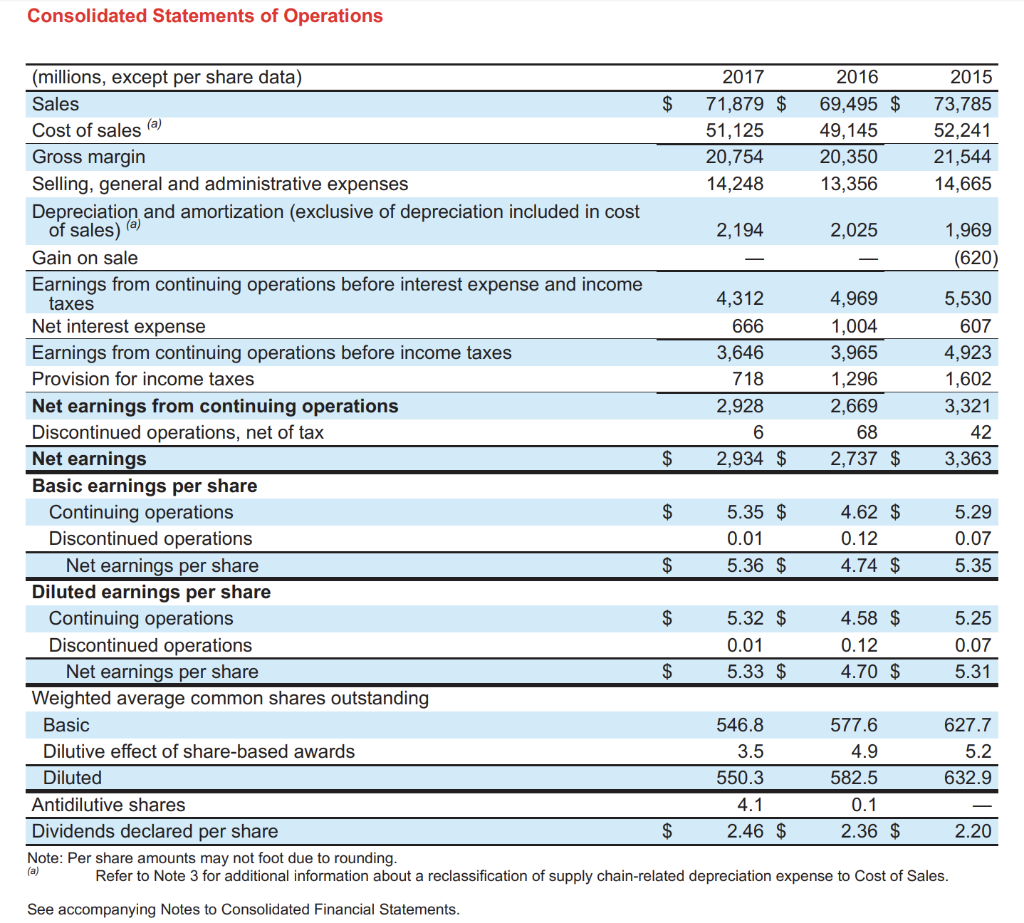
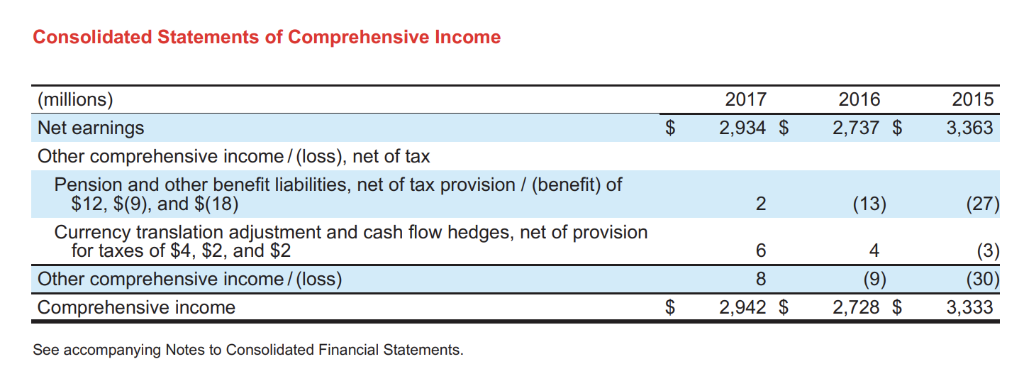
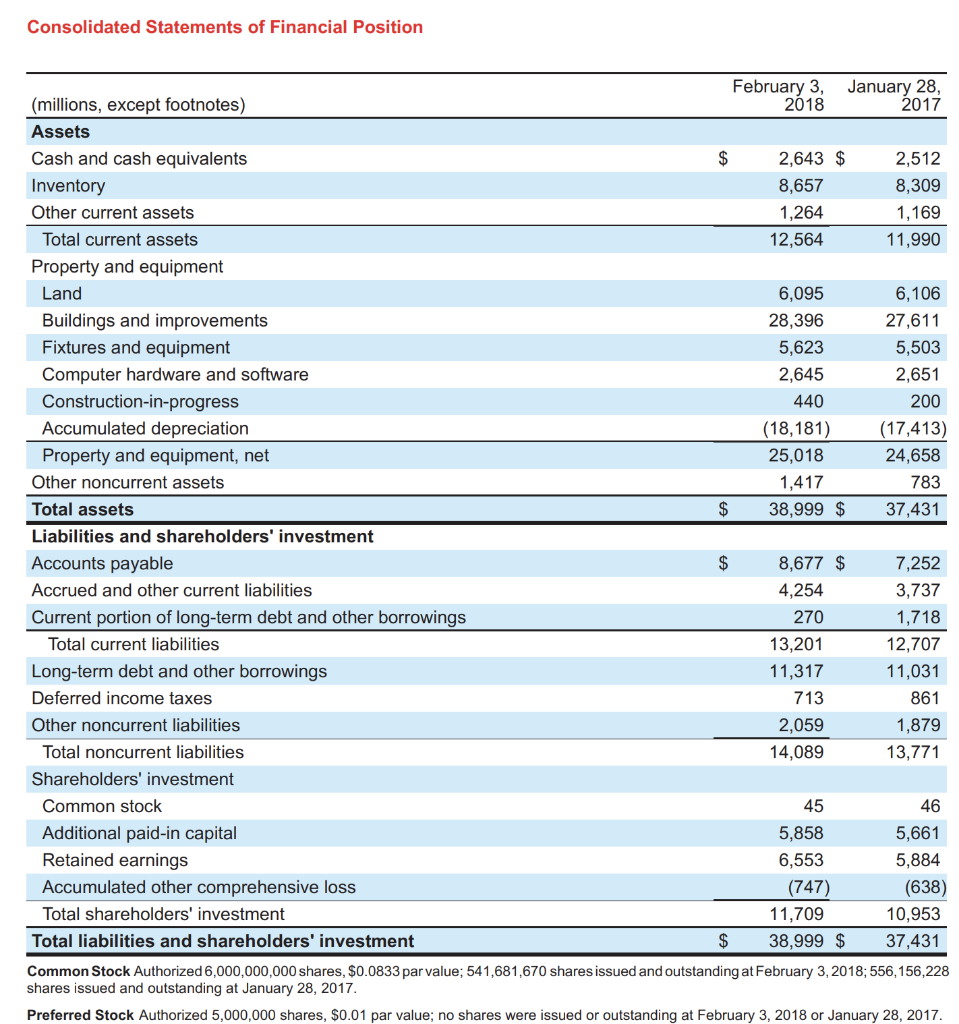
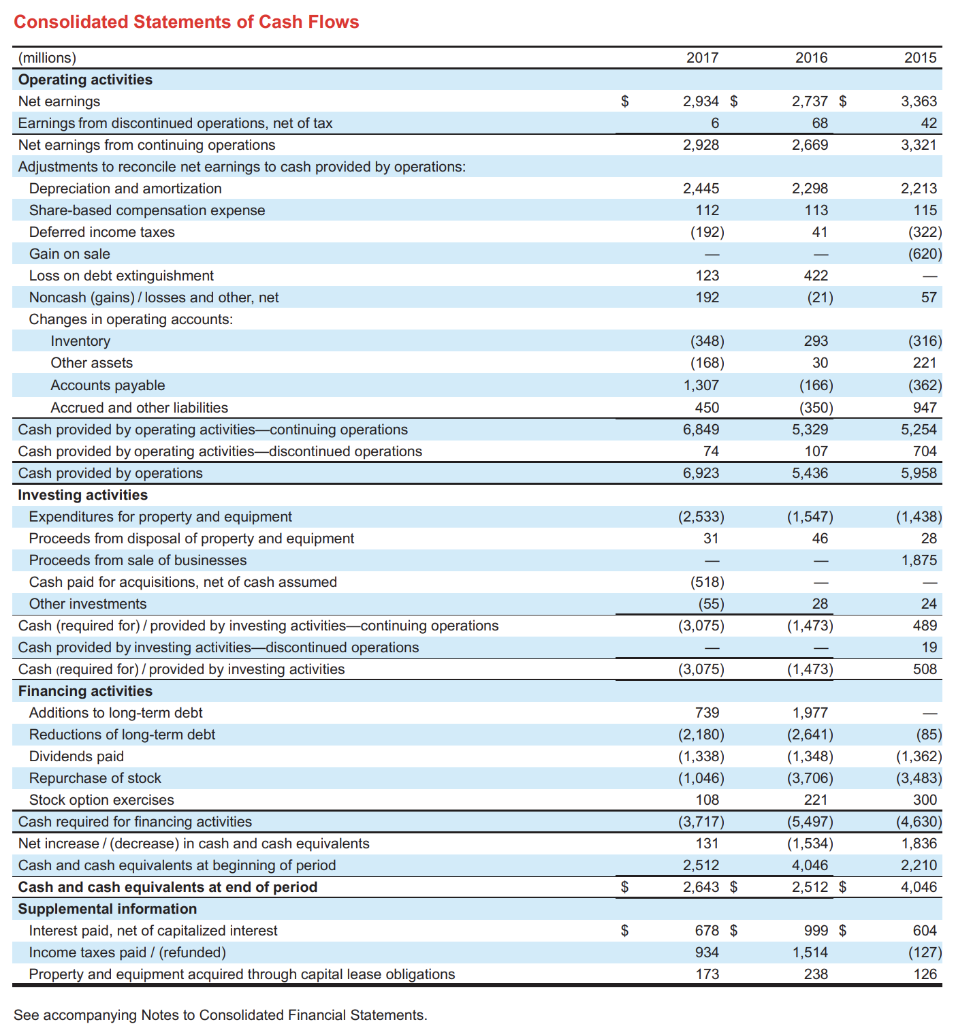
Calculate the following ratios. Be sure to clearly label and show your calculations and reference the information from the screenshots below.
A) Compute the following liquidity ratios using the pictures below:
- Current ratio
- Accounts receivable turnover
- Average collection period
- Inventory turnover (if the company does not have inventory, note and skip)
- Days in inventory (if the company does not have inventory, note and skip)
- Current cash debt coverage
B) Compute the following solvency ratios using the pictures below:
- Debt to asset ratio
- Times interest earned
- Cash debt coverage
- Free cash flow
C) Compute the following profitability ratios using the pictures below:
- Profit margin
- Asset turnover
- Return on assets
- Return on common stockholders equity.
D) Interpret your findings for the ratio comparatives analysis for this company.
E) Evaluate what, if any, options with regard to financial activities this company should consider (i.e., how can the company can improve financial performance)? What impact would each of these have on the above ratios?
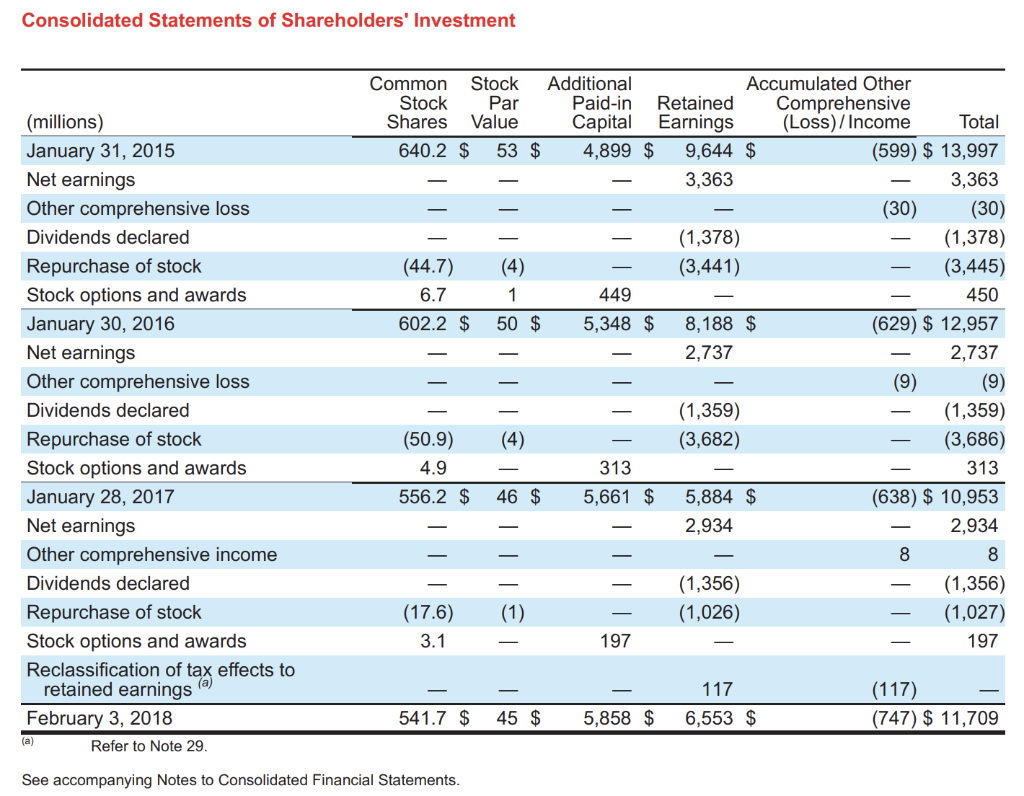
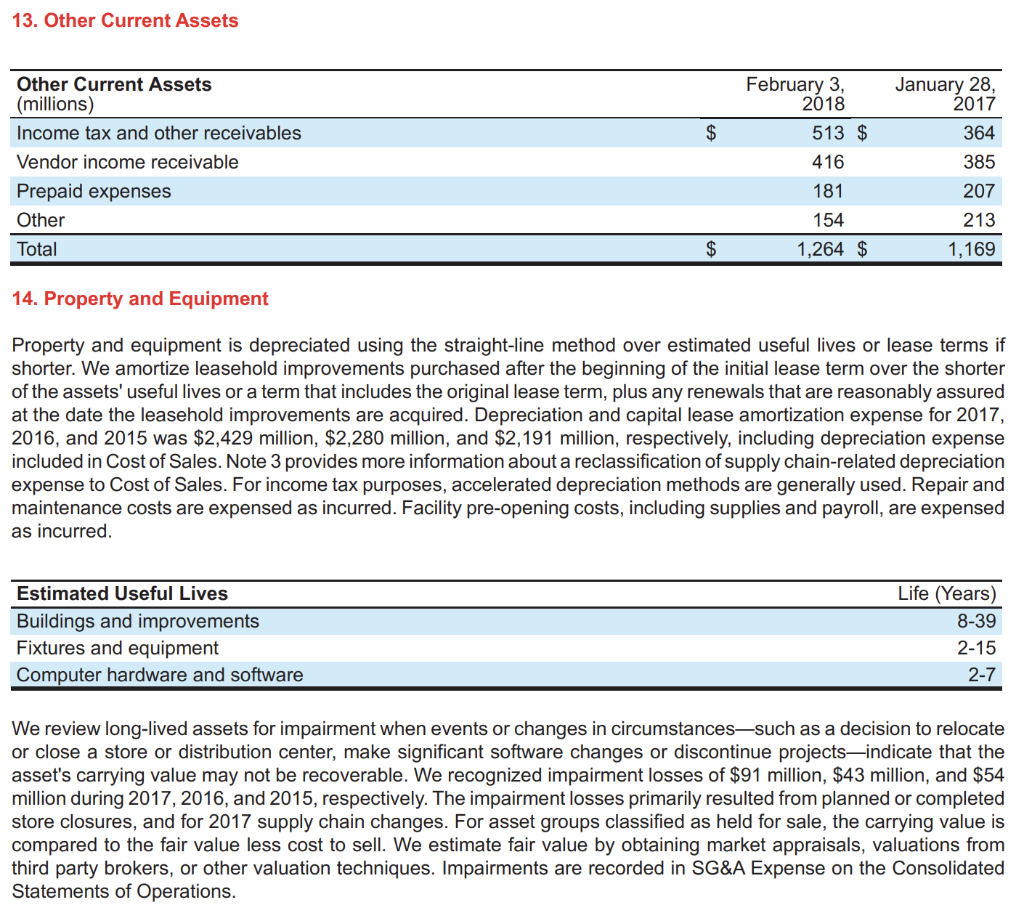

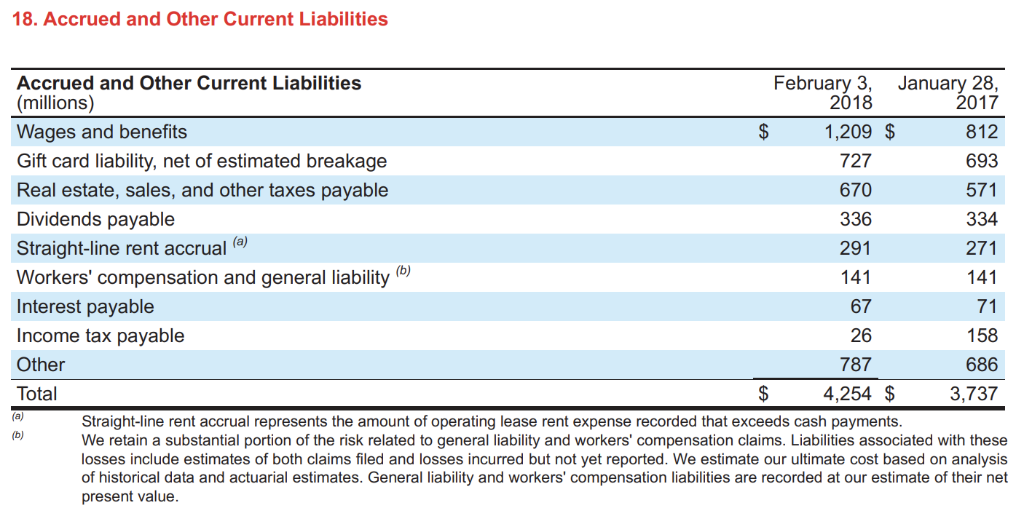
Consolidated Statements of Operations (millions, except per share data) Sales Cost of sales) Gross margin Selling, general and administrative expenses Depreciation and amortization (exclusive of depreciation included in cost 2015 $71,879 $ 69,495 $ 73,785 52,241 21,544 14,665 2017 2016 51,125 20,754 14,248 49,145 20,350 13,356 of sales) (a) Gain on sale Earnings from continuing operations before interest expense and income 2,194 2,025 1,969 4,969 1,004 3,965 1,296 2,669 68 4,312 taxes Net interest expense Earnings from continuing operations before income taxes Provision for income taxes Net earnings from continuing operations Discontinued operations, net of tax Net earnings Basic earnings per share 5,530 607 4,923 1,602 3,321 3,646 718 2,928 $ 2,934 $ 2,737 $ 3,363 Continuing operations Discontinued operations 5.35 $ 0.01 5.36 $ 4.62 $ 0.12 4.74 $ 5.29 0.07 5.35 Net earnings per share Diluted earnings per share 5.32 $ 0.01 5.33 $ 4.58 $ 0.12 4.70 $ Continuing operations Discontinued operations Net earnings per share 5.25 0.07 5.31 Weighted average common shares outstanding 627.7 5.2 632.9 Basic 577.6 546.8 3.5 550.3 Dilutive effect of share-based awards Diluted Antidilutive shares Dividends declared per share Note: Per share amounts may not foot due to rounding 582.5 2.46 $ 2.36 $ 2.20 Refer to Note 3 for additional information about a reclassification of supply chain-related depreciation expense to Cost of Sales. See accompanying Notes to Consolidated Financial Statements Consolidated Statements of Comprehensive Income 2015 $2,934 $ 2,737 $ 3,363 2017 2016 (millions) Net earnings Other comprehensive income / (loss), net of tax Pension and other benefit liabilities, net of tax provision / (benefit) of (13) $12, $(9), and $(18) Currency translation adjustment and cash flow hedges, net of provision 2 for taxes of $4, $2, and $2 Other comprehensive income/ (loss) Comprehensive income See accompanying Notes to Consolidated Financial Statements 6 4 (30) 3,333 8 $2,942 $2,728 $ Consolidated Statements of Cash Flows 2016 (millions) Operating activities Net earnings Earnings from discontinued operations, net of tax Net earnings from continuing operations Adjustments to reconcile net earnings to cash provided by operations 2017 2015 2,934 $ 2,737 $ 3,363 6 68 2,928 2,669 3,321 Depreciation and amortization Share-based compensation expense Deferred income taxes Gain on sale Loss on debt extinguishment Noncash (gains)/losses and other, net Changes in operating accounts 2,445 2,298 2,213 322) (620) 192) 123 192 57 Inventory Other assets Accounts payable Accrued and other liabilities 293 30 (348) 1,307 (362) 947 5,254 Cash provided by operating activities-continuing operation:s Cash provided by operating activities-discontinued operations Cash provided by operations Investing activities 5,329 107 5,436 6,849 6,923 5,958 Expenditures for property and equipment Proceeds from disposal of property and equipment Proceeds from sale of businesses Cash paid for acquisitions, net of cash assumed Other investments (2,533) (1,547) (1,438) 31 1,875 Cash (required for) provided by investing activities-continuing operations Cash provided by investing activities-discontinued operations Cash (required for)/provided by investing activities Financing activities 489 (1,473) 1,977 (1,348) (3,075) Additions to long-term debt Reductions of long-term debt Dividends paid Repurchase of stock Stock option exercises 739 (2,180) (1,338) (1,046) (1,362) (3,483) (3,706) Cash required for financing activities Net increase/(decrease) in cash and cash equivalents Cash and cash equivalents at beginning of period Cash and cash equivalents at end of period Supplemental information 3,717) 131 2,512 (4,630) 1,836 2,210 4,046 (1,534) 4,046 2,643 $ 678 $ Interest paid, net of capitalized interest Income taxes paid/(refunded) Property and equipment acquired through capital lease obligations 604 173 See accompanying Notes to Consolidated Financial Statements Consolidated Statements of Shareholders' Investment Common Stock Additional Accumulated Other Paid-in Retained Comprehensive StockPar (millions) January 31, 2015 Net earnings Other comprehensive loss Dividends declared Repurchase of stock Stock options and awards January 30, 2016 Net earnings Other comprehensive loss Dividends declared Repurchase of stock Stock options and awards January 28, 2017 Net earnings Other comprehensive income Dividends declared Repurchase of stock Stock options and awards Reclassification of tax effects to Shares ValueCapital Earnings Loss)/Income Total (599) $ 13,997 -3,363 (30) (30) (1,378) (3,445) 450 (629) $ 12,957 _ 2,737 640.2 $ 53 $ 4,899 $ 9,644$ 3,363 (1,378) (3,441) 6.7 449 602.2 $ 50$ 5,348 $ 8,188 $ 2,737 (1,359) (3,682) -(1,359) (3,686) 313 (638) $ 10,953 2,934 (50.9) (4) 4.9 313 556.2 $ 46 $ 5,661 $ 5,884 $ 2,934 8 (1,356) (1,026) (1,356) (1,027) 197 197 retained earnings February 3, 2018 541.7 $ 45 $ 5,858 $ 6,553 $ (747) $ 11,709 Refer to Note 29 See accompanying Notes to Consolidated Financial Statements 11. Cash and Cash Equivalents Cash equivalents include highly liquid investments with an original maturity of three months or less from the time of purchase. Cash equivalents also include amounts due from third-party financial institutions for credit and debit card transactions, which typically settle in five days or less February 3, January 28, (millions) Cash held by U.S. entities Cash held by entities located outside the U.S Short-term investments held by U.S. entities Short-term investments held by entities located outside the U.S. e) Receivables from third-party financial institutions for credit and debit card transactions Cash and cash equivalents 304 $ 257 17 1,110 762 366 2,512 1,131 775 400 2,643 $ There are no substantial taxes or restrictions to repatriate these holdings for domestic use 13. Other Current Assets February 3, 2018 Other Current Assets (millions) Income tax and other receivables Vendor income receivable January 28, 513 $ 416 181 154 2017 364 385 207 213 1,169 Prepaid expenses Other Total 1,264 $ 14. Property and Equipment Property and equipment is depreciated using the straight-line method over estimated useful lives or lease terms if shorter. We amortize leasehold improvements purchased after the beginning of the initial lease term over the shorter of the assets' useful lives or a term that includes the original lease term, plus any renewals that are reasonably assured at the date the leasehold improvements are acquired. Depreciation and capital lease amortization expense for 2017, 2016, and 2015 was $2,429 million, $2,280 million, and $2,191 million, respectively, including depreciation expense included in Cost of Sales. Note 3 provides more information about a reclassification of supply chain-related depreciation expense to Cost of Sales. For income tax purposes, accelerated depreciation methods are generally used. Repair and maintenance costs are expensed as incurred. Facility pre-opening costs, including supplies and payroll, are expensed as incurred Estimated Useful Lives Buildings and improvements Fixtures and equipment Computer hardware and software Life (Years) 8-39 2-15 2-7 We review long-lived assets for impairment when events or changes in circumstances-such as a decision to relocate or close a store or distribution center, make significant software changes or discontinue projects-indicate that the asset's carrying value may not be recoverable. We recognized impairment losses of $91 million, $43 million, and $54 million during 2017, 2016, and 2015, respectively. The impairment losses primarily resulted from planned or completed store closures, and for 2017 supply chain changes. For asset groups classified as held for sale, the carrying value is compared to the fair value less cost to sell. We estimate fair value by obtaining market appraisals, valuations from third party brokers, or other valuation techniques. Impairments are recorded in SG&A Expense on the Consolidated Statements of Operations 17. Accounts Payable AtFebruary 3,2018 and January 28,2017, we reclassified book overdrafts of $358 million and $459 million, respectively, to Accounts Payable and $29 milion and $24 million, respectively, to Accrued and Other Current Liabilities. 18. Accrued and Other Current Liabilities Accrued and Other Current Liabilities (millions) Wages and benefits Gift card liability, net of estimated breakage Real estate, sales, and other taxes payable Dividends payable Straight-line rent accrual (o) Workers' compensation and general liability Interest payable Income tax payable Other Tota February 3, January 28, 2018 1,209 $ 727 670 336 291 2017 812 693 571 334 271 141 71 158 686 3,737 67 26 787 4,254 $ Straight-line rent accrual represents the amount of operating lease rent expense recorded that exceeds cash payments We retain a substantial portion of the risk related to general liability and workers' compensation claims. Liabilities associated with these losses include estimates of both claims filed and losses incurred but not yet reported. We estimate our ultimate cost based on analysis of historical data and actuarial estimates. General liability and workers' compensation liabilities are recorded at our estimate of their net present value