Calculate the Free Cash Flow and Economic Value Added for Home Depot for 2019. I have attached a
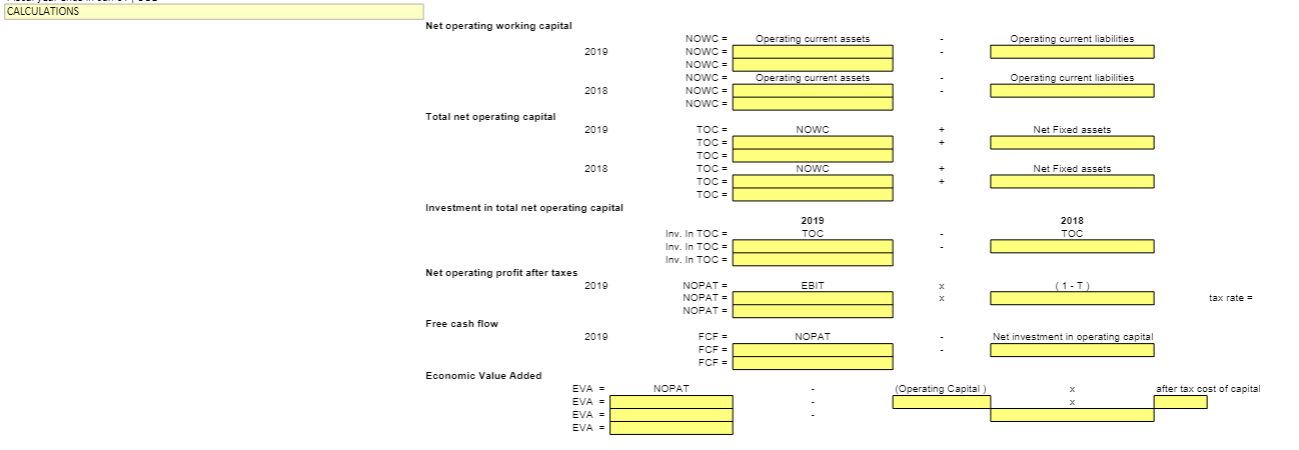
worksheet template which includes the following:
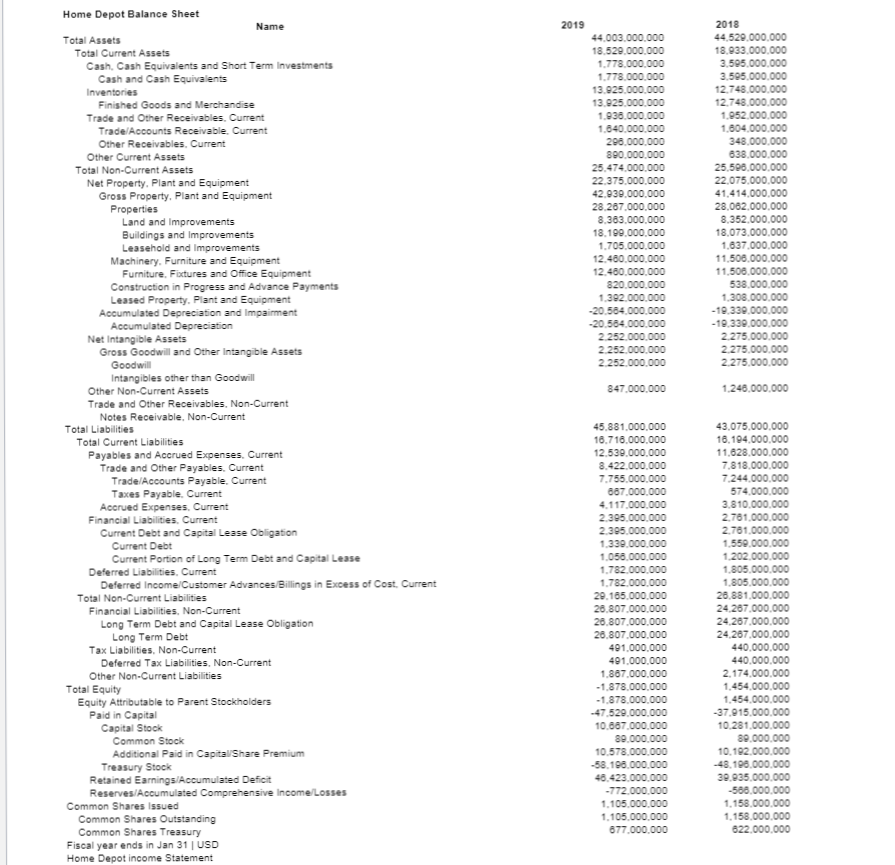
Home Depot's Balance Sheet data for 2019 and 2018 from Morningstar
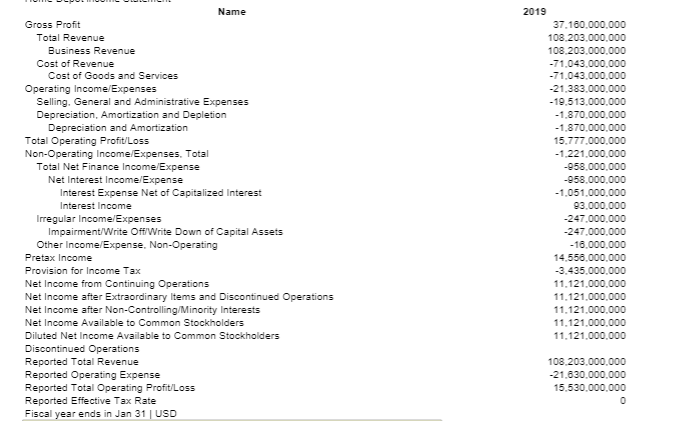
Home Depot's Income Statement data for 2019 from Morningstar
1. Complete the highlighted areas at the bottom of the worksheet to calculate the following :
Net Operating Working Capital (NOWC)
Total net operating Capital (TOC)
Calculate for 2016
Investment in Total Net Operating Capital (Inv. In TOC)
Net Operating Profit after Taxes (NOPAT)
Free Cash Flow (FCF)
Economic Value Added (EVA)
You may assume a wacc=5% and estimate the tax rate (T) using the equation below:
taxes paid/taxable income. Both values are found in the income statement.
2.
When you have completed #1 for Home Depot, one paragraph analysis of your results. In
your analysis, describe in common language what your values for FCF and EVA indicate for the
company for 2019. Explain whether your results are positive or negative indicators for the
current state of the company. Remember to include
Morningstar as one of your sources. Cite any additional sources you may use in the calculations or
Home Depot Balance Sheet Name 2019 2018 Total Assets 44.003.000.000 44.520.000,000 Total Current Assets 18.529.000,000 18.933,000.000 Cash. Cash Equivalents and Short Term Investments 1.778.000,000 3.505.000,000 Cash and Cash Equivalents 1.778.000.00 3.505.000.000 Inventories 13.925.000. 12.748.000.000 Finished Goods and Merchandise 13.825.000.0 12.748.000.000 Trade and Other Receivables, Current 1.938.00 1,852.000.00 Trade/Accounts Receivable, Current 1.840.000.00 1.804.000.00 Other Receivables, Current 208.000,00 348.000.000 Other Current Assets 890.000,00 638,000.000 Total Non-Current Assets 25.474,000,000 25.598.000.000 Net Property. Plant and Equipment 22.375.000,000 22.075.000.000 Gross Property, Plant and Equipment 42.939,000,00 41.414,000,000 Properties 28.267.000,000 28.062.000.000 Land and Improvements 8.363,000,000 8.352.000.000 Buildings and Improvements 18.190,000,000 18.073.000.000 Leasehold and Improvements 1.705,000,000 1.637.000.000 Machinery. Furniture and Equipment 12.480,000,000 11.506,000.000 Furniture, Fixtures and Office Equipment 12.480.000.00 11.508.000.000 Construction in Progress and Advance Payments 820.000.00 538,000,000 Leased Property. Plant and Equipment 1.392.000.000 1.308.000.00 Accumulated Depreciation and Impairment -20.584,000.000 -18.338.000.000 Accumulated Depreciation 20.584.000.000 -19.330.000.000 Net Intangible Assets 2.252.000.00 2.275.000 Gross Goodwill and Other Intangible Assets 2.252.000,000 2.275.000.000 Goodwill 2 252.000.000 2.275.000.000 Intangibles other than Goodwill Other Non-Current Assets 847.000,000 1.248.000.000 Trade and Other Receivables, Non-Current Notes Receivable, Non-Current Total Liabilities 45,881,000,000 43,075.000.000 Total Current Liabilities 18.716.000,000 16.194.000.000 Payables and Accrued Expenses, Current 12.539,000,000 11.628.000.000 Trade and Other Payables. Current 8.422.000,000 7.818.000.000 Trade/Accounts Payable, Current 7.755.000.000 7.244.000.000 Taxes Payable. Current 687.000.00 574.000,000 Accrued Expenses, Current 4.117.000,000 3.810.000,000 Financial Liabilities, Current 2.395.000 2.781.000.000 Current Debt and Capital Lease Obligation 2.385.000.00 2.781.000.000 Current Debt 1,339.000 1.559.000.00 Current Portion of Long Term Debt and Capital Lease 1.056.000.00 1.202.000.000 Deferred Liabilities, Current 1.782.000.00 1.805.000.000 Deferred Income/Customer Advances/Billings in Excess of Cost. Current 1.782.000,000 1.805.000.000 Total Non-Current Liabilities 29.185,000,000 26.881.000.000 Financial Liabilities, Non-Current 26.807,000,00 24.267.000,000 Long Term Debt and Capital Lease Obligation 26.807,000,000 24.267.000.000 Long Term Debt 28.807,000. 24.287.000.000 Tax Liabilities, Non-Current 491,000,000 440.000.000 Deferred Tax Liabilities, Non-Current 491,000,000 440.000,000 Other Non-Current Liabilities 1.887.000,000 2.174,000.000 Total Equity -1.878.000,000 1.454,000,000 Equity Attributable to Parent Stockholders -1.878.000,000 1.454,000.000 Paid in Capital 47.529.000,000 37.915.000.000 Capital Stock 10.687.000.000 10.281.000.000 Common Stock 89.000.00 89.000.000 Additional Paid in Capital/Share Premium 10.578.000.00 10.182.000.00 Treasury Stock 58.108.000.00 -48.196.000.00 Retained Earnings/Accumulated Deficit 48.423.000.00 30.935.000.00 Reserves/Accumulated Comprehensive Income/Losses -772.000.000 -568.000.000 Common Shares Issued 1.105.000,000 1.158,000.000 Common Shares Outstanding 1.105,000,000 1.158.000.000 Common Shares Treasury 877.000.000 622.000.000 Fiscal year ends in Jan 31 | USD Home Depot income StatementName 2019 Gross Profit 37.160.000.000 Total Revenue 108.203,000,000 Business Revenue 108.203.000.000 Cost of Revenue -71.043.000,000 Cost of Goods and Services -71.043.000,000 Operating Income/Expenses -21.383.000.000 Selling. General and Administrative Expenses -19.513.000,000 Depreciation, Amortization and Depletion -1.870.000.000 Depreciation and Amortization -1.870.000,000 Total Operating Profit/Loss 15.777.000,000 Non-Operating Income/Expenses. Total -1.221.000,000 Total Net Finance Income/Expense -958.000,000 Net Interest Income/Expense -958,000,000 Interest Expense Net of Capitalized Interest -1.051,000,000 Interest Income 83.000.000 Irregular Income/Expenses -247.000,000 Impairment/Write Off/Write Down of Capital Assets -247.000,000 Other Income/Expense. Non-Operating -18.000,000 Pretax Income 14.556.000,000 Provision for Income Tax -3.435.000,000 Net Income from Continuing Operations 11.121.000,000 Net Income after Extraordinary Items and Discontinued Operations 11.121,000,000 Net Income after Non-Controlling/Minority Interests 11.121,000,000 Net Income Available to Common Stockholders 11.121,000,000 Diluted Net Income Available to Common Stockholders 11.121,000,000 Discontinued Operations Reported Total Revenue 108.203.000.000 Reported Operating Expense -21.830.000,000 Reported Total Operating Profit/Loss 15.530.000,000 Reported Effective Tax Rate 0 Fiscal year ends in Jan 31 | USDCALCULATIONS Net operating working capital NOWC = Operating current assets Operating current liabilities 2019 NOWC = NOWC = NOWC = Operating current assets Operating current liabilities 2018 NOWC = NOWC = Total net operating capital 2019 TOC = NOWC Net Fixed assets TOC = TOC = 2018 TOC = NOWC Net Fixed assets TOC = TOC = Investment in total net operating capital 2019 2018 Inv. In TOC = TOC Inv. In TOC = Inv. In TOC = Net operating profit after taxes 2018 NOPAT = EBIT ( 1 - T ) NOPAT = tax rate = NOPAT = Free cash flow 2019 FOF = NOPAT Net investment in operating capital FOF = FOF Economic Value Added EVA = NOPAT (Operating Capital ) after tax cost of capital EVA = EVA EVA


