

Answered step by step
Verified Expert Solution
Question
1 Approved Answer
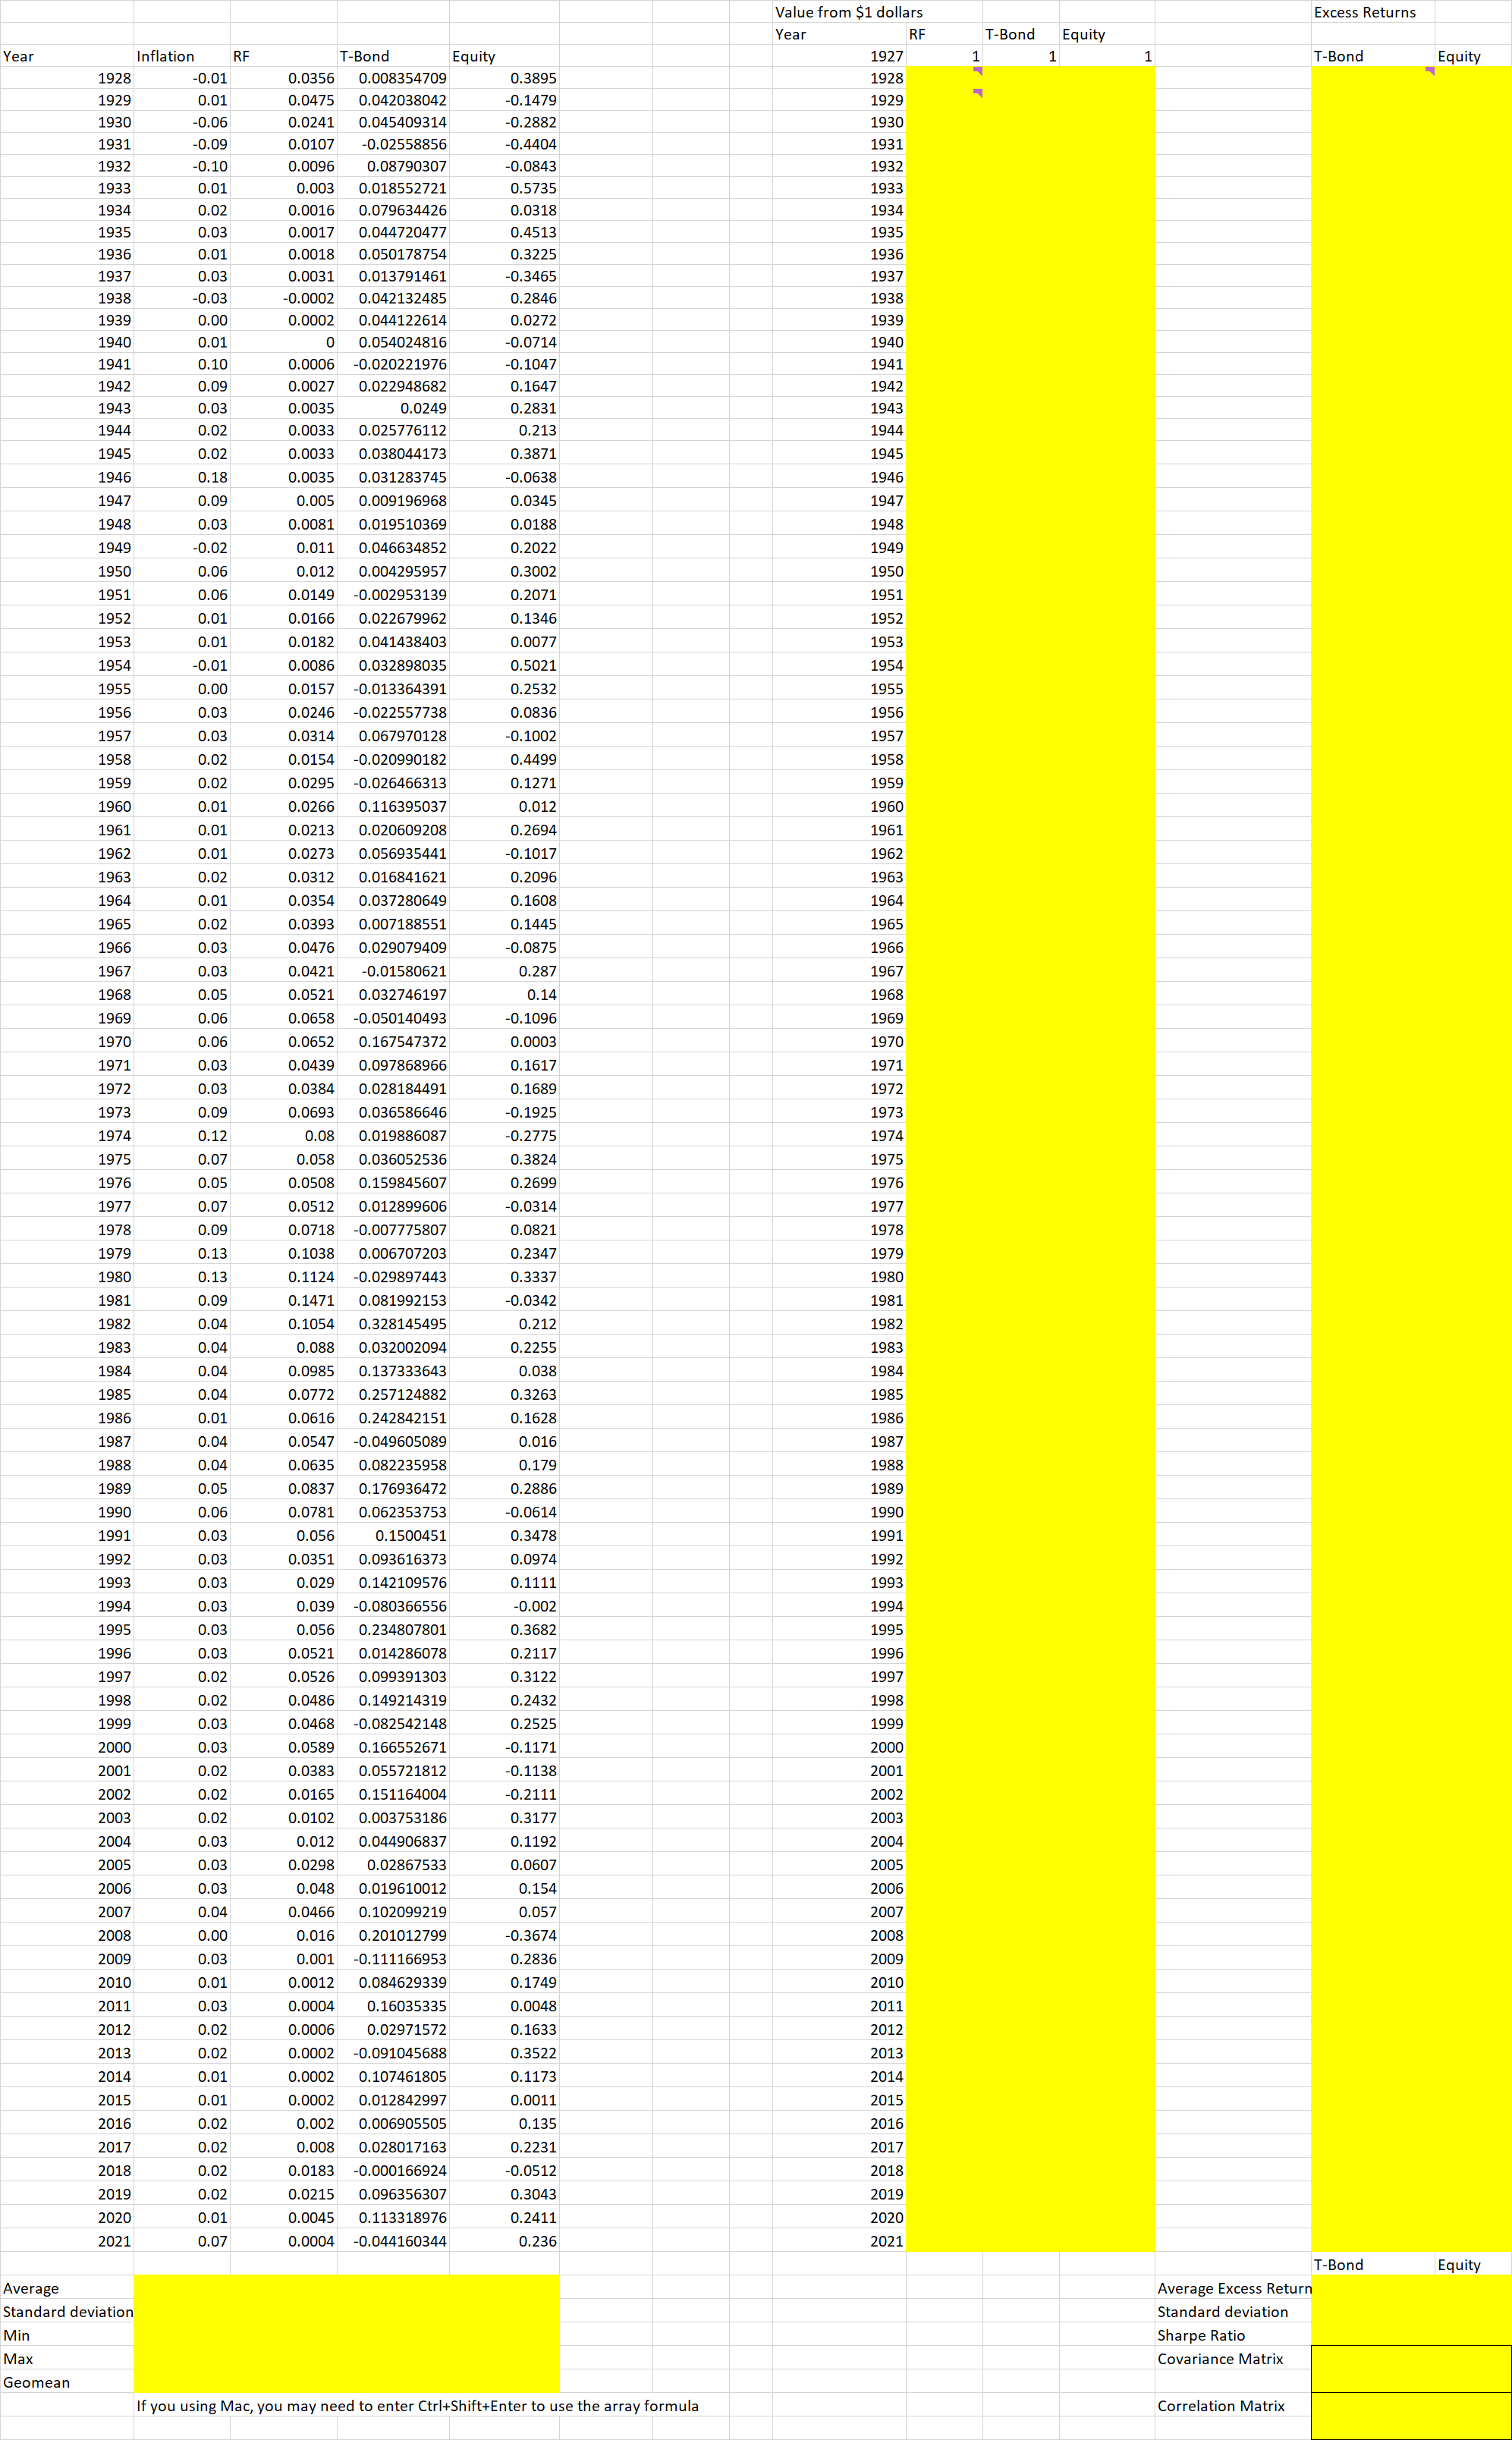
Calculate the summary statistics: Arithmetic average, standard deviation, Min, Max, and geometric average. Calculate the end - of - year values for each asset class
Calculate the summary statistics: Arithmetic average, standard deviation, Min, Max, and geometric average.
Calculate the endofyear values for each asset class RF TBond and Equity with $ investment at the end of And plot them in a Chart. Make sure that you use the log scale on the yaxis.
Calculate annual excess returns time series for Tbond and Equity. Present the average excess returns, standard deviations, and Sharpe ratio.
Present the covariance and correlation matrix of the excess returns of Tbond and Equity.
Step by Step Solution
There are 3 Steps involved in it
Step: 1

Get Instant Access to Expert-Tailored Solutions
See step-by-step solutions with expert insights and AI powered tools for academic success
Step: 2

Step: 3
Ace Your Homework with AI
Get the answers you need in no time with our AI-driven, step-by-step assistance
Get Started
R In Finance And Economics A Beginners Guide
Authors: Abhay Kumar Singh, David Edmund Allen
1st Edition
9813144467, 978-9813144460