calculating stock beta in excel and see the examples to draw the following graphs
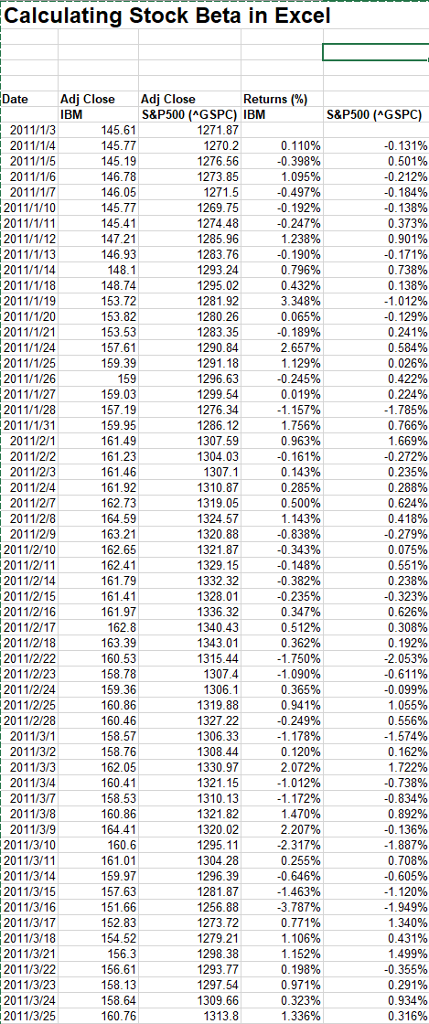
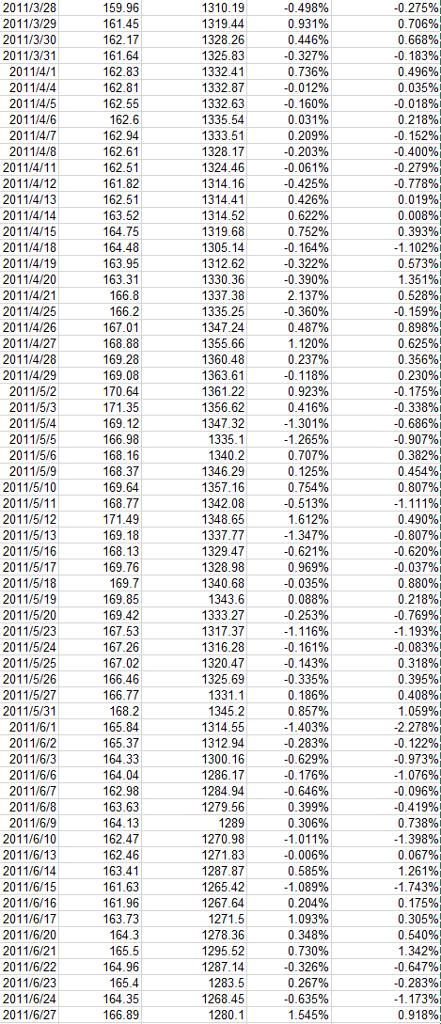
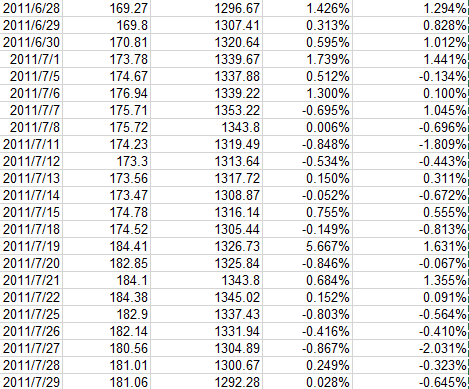
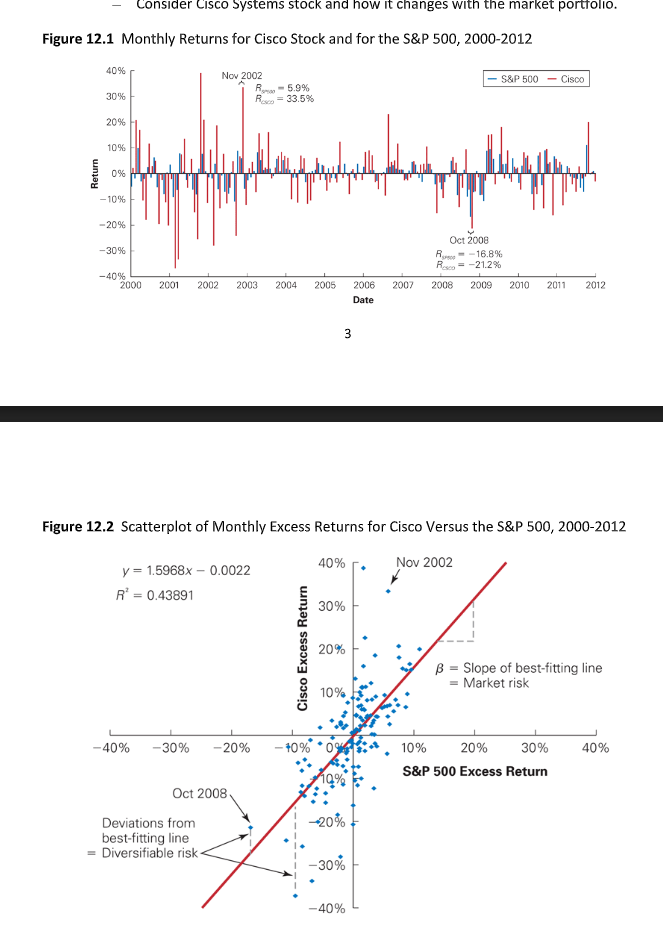
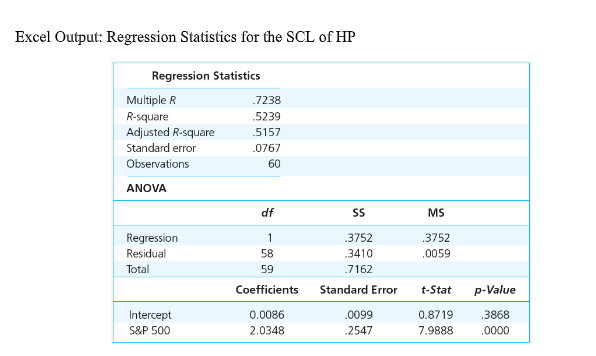
Calculating Stock Beta in Excel ate Adj Close Adj Close Returns (%) S&P500 (AGSPC) IBM S&P500 (GSPC) 2011/1/3 271.87 2011/1/4 2011/1/5 2011/1/6 2011/1/7 2011/1/10 2011/1/11 2011/1/12 2011/1/13 2011/1/14 2011/1/18 2011/1/19 2011/1/20 2011/1/21 2011/1/24 2011/1/25 2011/1/26 2011/1/27 2011/1/28 2011/1/31 2011/2/1 2011/2/2 2011/2/3 2011/214 2011/27 2011/2/8 2011/2/9 2011/2110 2011/2/11 2011/2/14 2011/2/15 2011/2/16 2011/2/17 2011/2/18 2011/2/22 2011/2/23 2011/2/24 2011/2/25 2011/2/28 2011/3/1 2011/3/2 2011/3/3 2011/34 2011/3/7 2011/3/8 2011/3/9 2011/3/10 2011/3/11 2011/3/14 2011/3/15 2011/3/16 2011/3/17 0 501% 0.184% 0.373% 1276.56 1273.85 -0.398% 109596 -0497% -0.19296 -0.247% 1269.75 0.90196 5.96 1283.76 1293.24 -0.190% 0.796% 0.738% 0.138% 1280.26 1283.35 0.065% 0.584% 1296.63 -0.245%, 0.422% 1.756% 1304.03 1.46 0.288% 1324.57 321.87 130 0.418% -0 279% 0.075% 055196 162.65 -0.343%, -0.382% 1328.01 13404312% 0.362% 2.053% -061196 -0.099% 1 09096 9.36 -0.249% 0.556% 1306.33 1308.44 8.76 2.05 2.0 1.47096 2.207% -2.317% 1321.82 -0.1 3696 1 887% 0.708% 160.6 1295.11 1304.28 3.787% 1273.72 1. 106% 0.431% 1.401)% 355% 0.291% 0.934% 2011/3/18 2011/3/21 2011/3/22 2011/3/23 2011/3/24 2011/3/25 1298.38 0.971% 1310.19-0.498 % 0.931% 0.446%, 2011/3/28 2011/3/29 2011/3/30 2011/3/31 2011/4/1 201114/4 2011/4/5 201114/6 2011/4/7 2011/4/8 2011/4/11 2011/4/12 2011/4/13 2011/4/14 2011/4/15 2011/4/18 2011/4/19 2011/4/20 2011/4/21 2011/4/25 2011/4/26 2011/4/27 2011/4/28 2011/4/29 2011/5/2 2011/5/3 2011/5/4 2011/5/5 2011/5/6 2011/5/ 2011/5/10 2011/5/11 2011/5/12 2011/5/13 2011/5/16 2011/5/17 2011/5/18 2011/5/19 2011/5/20 2011/5/23 2011/5/24 2011/5/25 2011/5/26 2011/5/27 2011/5/31 2011/6/1 2011/6/2 2011/6/3 2011/6/6 2011/6/7 2011/6/8 2011/6/9 2011/6/10 2011/6/13 2011/6/14 2011/6/15 2011/6/16 2011/6/17 2011/6/20 2011/6/21 2011/6/22 2011/6/23 2011/6/24 2011/6/27 59.96 0.706% 0.668% 1328.26 1332.41 1332.87 1332.63 0.496% 0.012% -0.160%, 0.031% 0.209%, 0.218% 1328.17 324.46 -0.425% 0.426% 0.393% 0.573% 0.628%, 0.898% -0.390% 1337.38 1347.24 0.625% 1361.22 0.754% 1342.08 1348.65 0.490% 132947 1328.98 -0.035% 0.088% -0.769% 333.27 1317.37 1320.47 1325.69 0.318% 1314.55 -2278% -0 629% 1270.98 -0 006% 0 585% 1287.87 1265.42 1. 093% 1295.52 0. 267% 1268.45 531751 0135 8 0305403 10110010100000101000200 6359205 2 43575360 8 2 193109 5 -00-01-00000000500000000 1 64 1 2 6 8 3 937865 23333331333333331 3332 12336782151894616 547548 96034655473344 18888 8 1234589 Consider Cisco Systems stock and how it changes with the market portfolio - Figure 12.1 Monthly Returns for Cisco Stock and for the S&P 500, 2000-2012 40% 30% 20% Nov 2002 S&P 500-Cisco R-,-33.5% 10% 0% -10% -20% Oct 2008 -30% Rimg-"-16.8% R,e,--21.2% -40% 2000 200 2002 2003 2004 2005 2006 2007 2008 2009 2010 2011 2012 Date Figure 12.2 Scatterplot of Monthly Excess Returns for Cisco Versus the S&P 500, 2000-2012 40% Nov 2002 y 1.5968x 0.0022 R 0.43891 30% 20% B Slope of best-fitting line Market risk 10% :*, 10% 20% S&P 500 Excess Return -40% -30% -20% - 30% 40% Oct 2008 | -20% | -30% 40% Deviations from best-fitting line Diversifiable risk Excel Output: Regression Statistics for the SCL of HP Regression Statistics Multiple R R-square Adjusted R-square Standard error Observations 7238 5239 5157 0767 60 ANOVA df MS Regression Residual Total 3752 3752 .0059 58 59 3410 7162 Coefficients Standard Error t-Stat pValue Intercept S&P 500 0.0086 2.0348 0099 2547 0.8719 3868 7.9888


