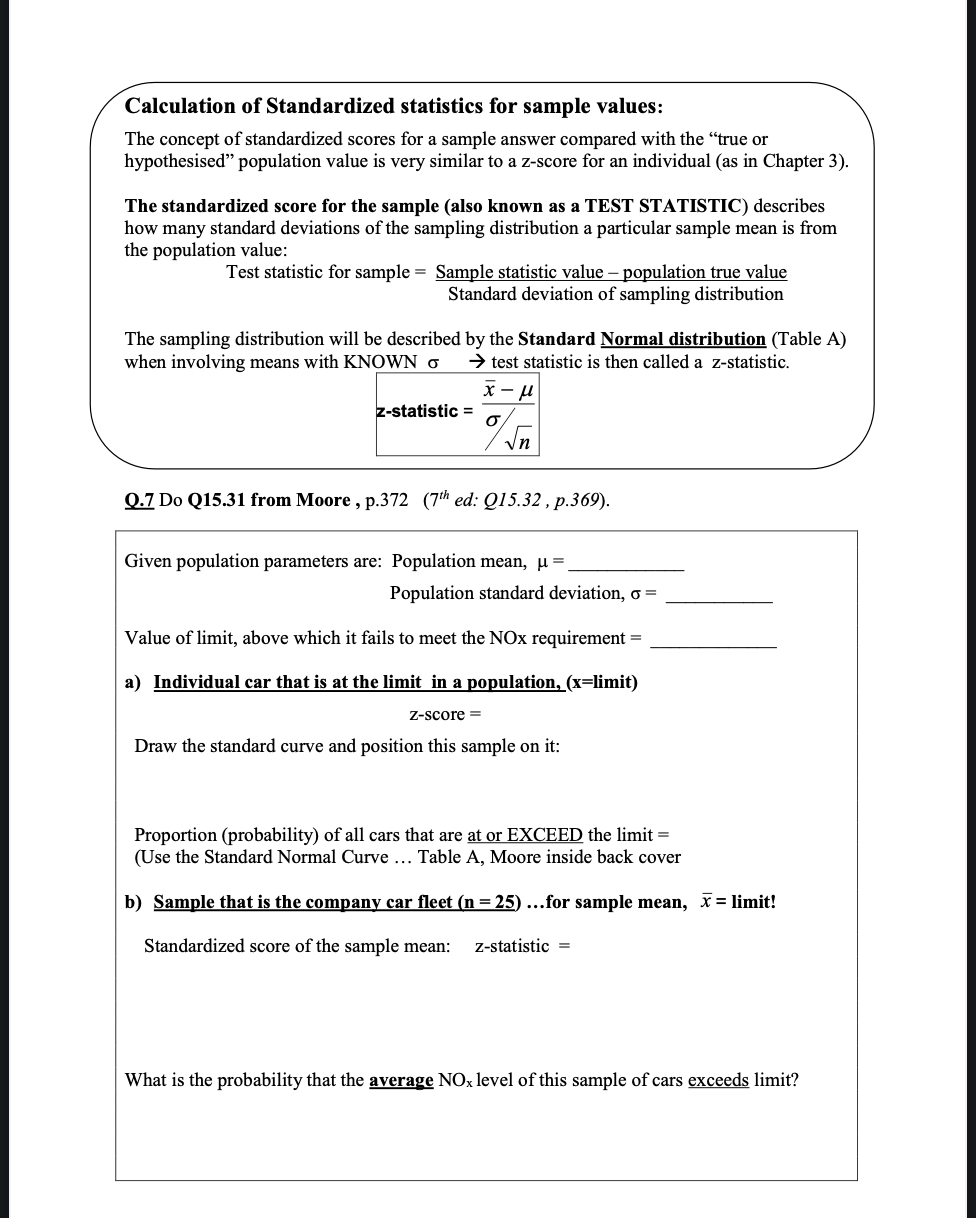
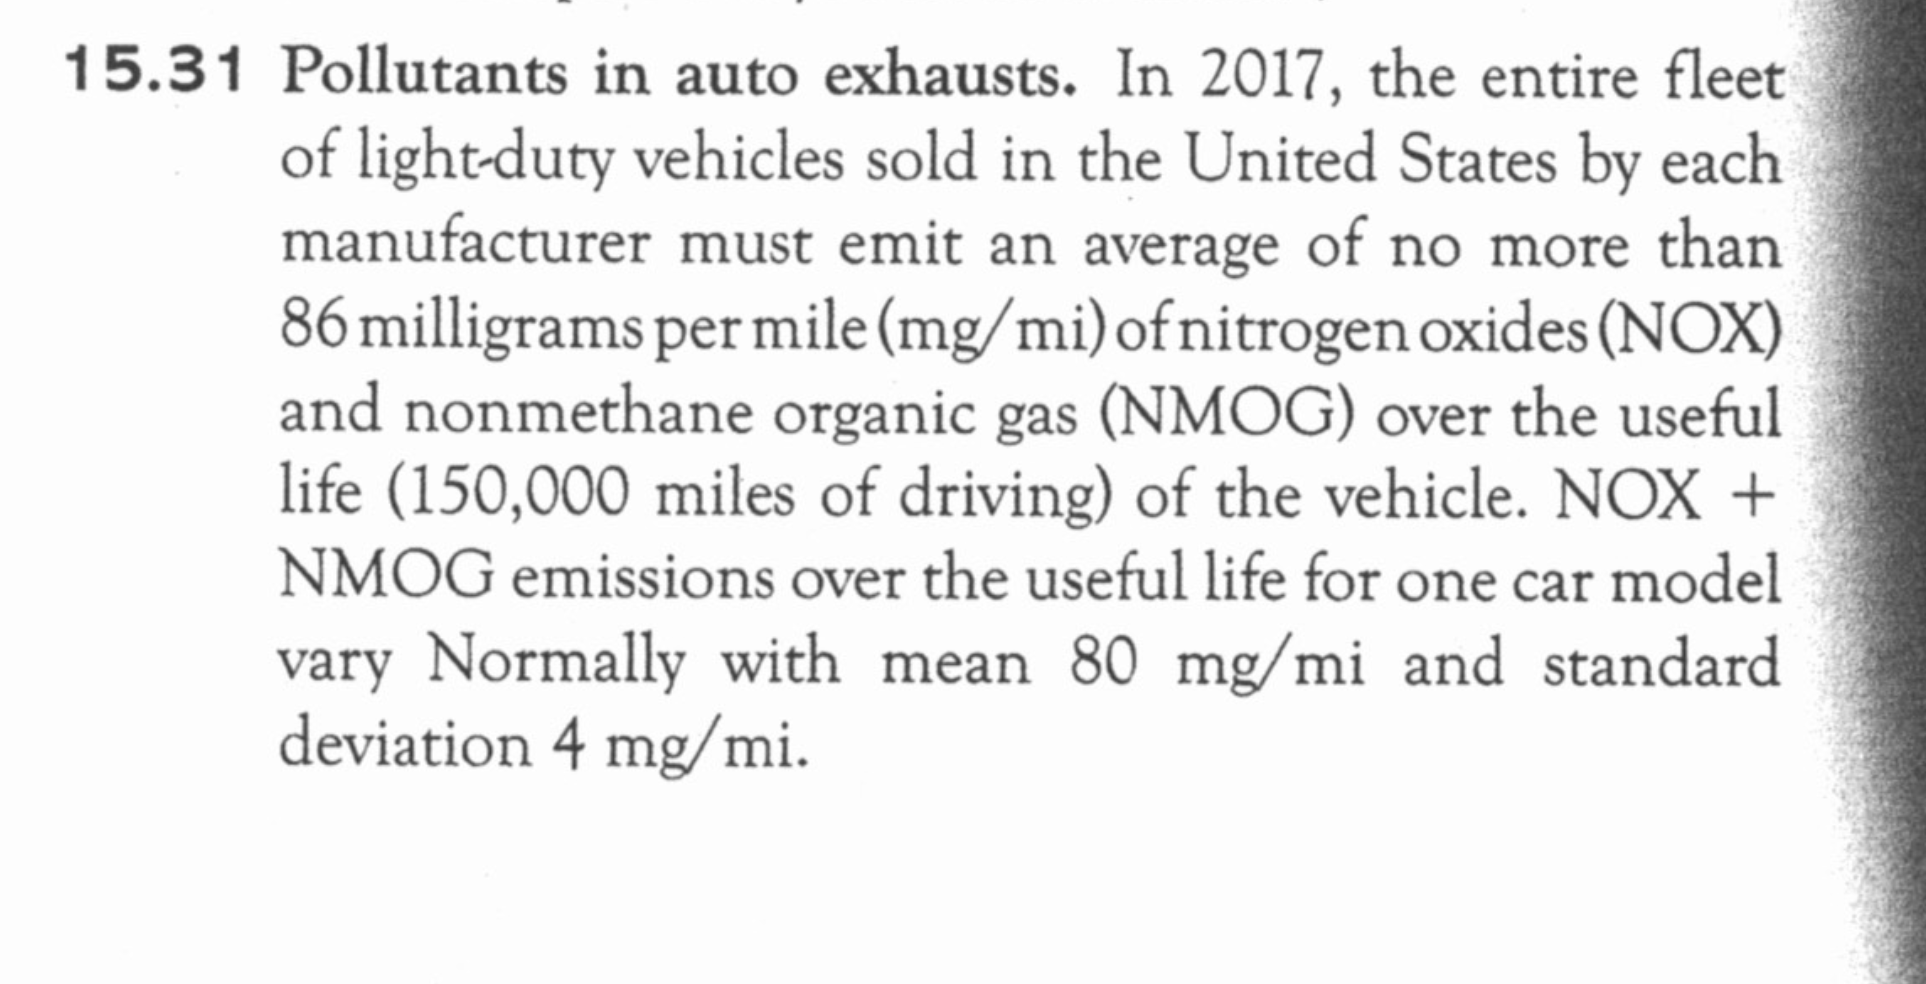
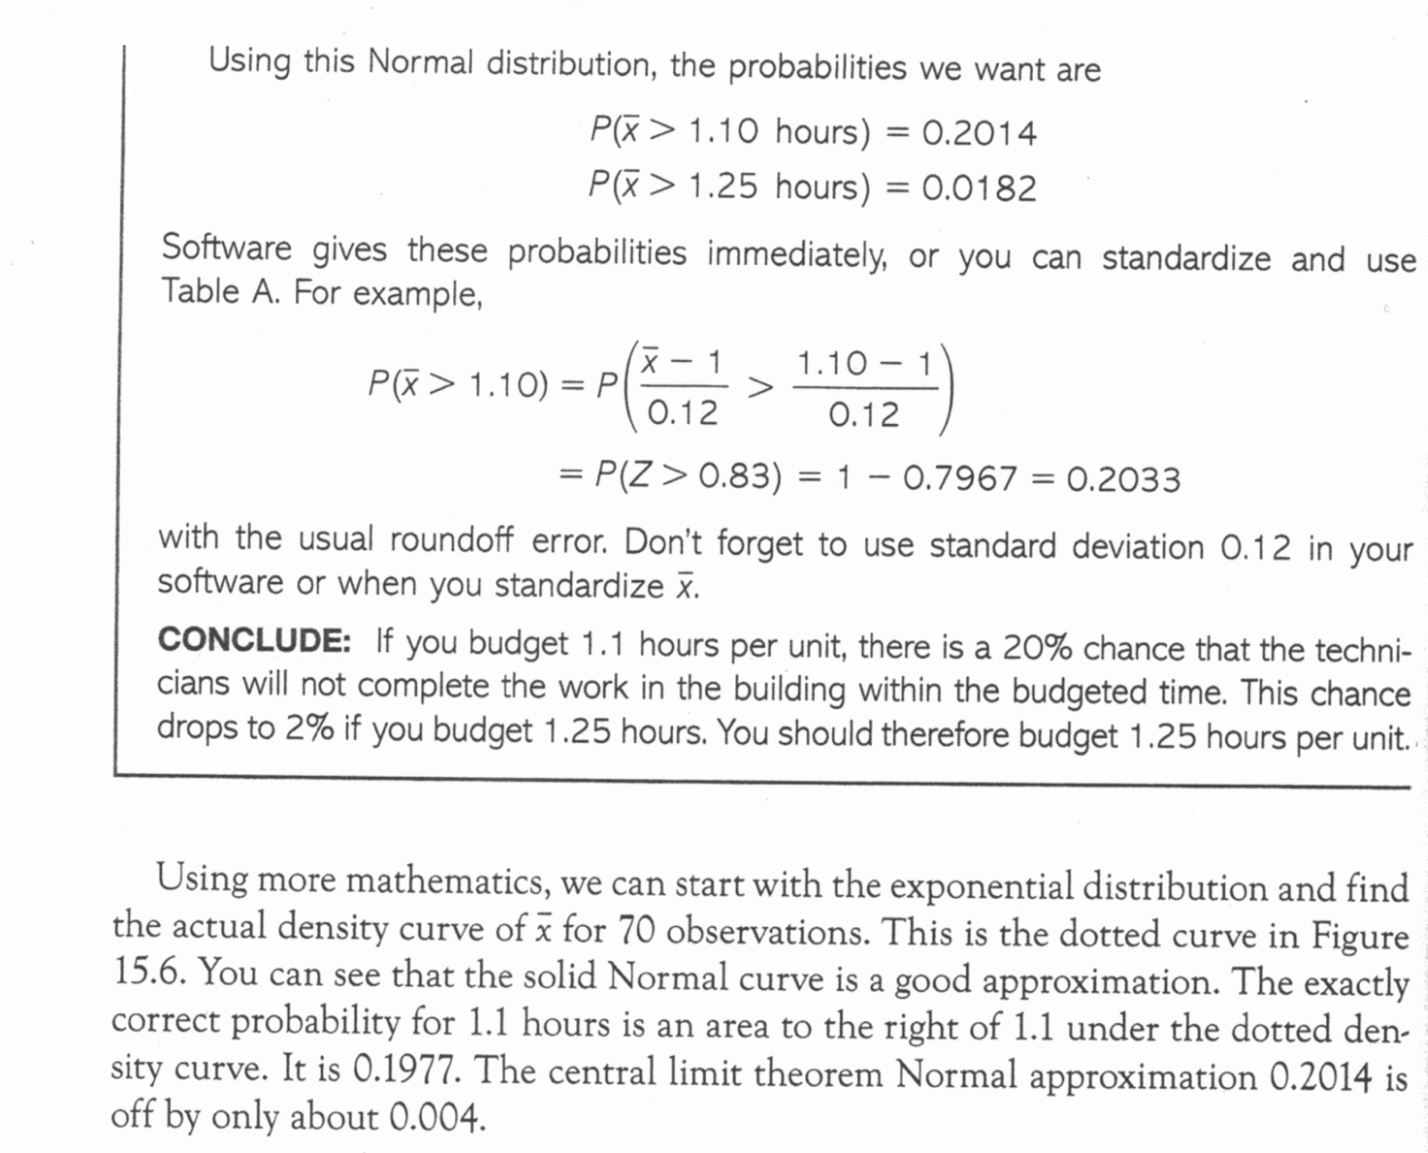
Calculation of Standardized statistics for sample values: The concept of standardized scores for a sample answer compared with the \"true or hypothesised\" population value is very similar to a z-score for an individual (as in Chapter 3). The standardized score for the sample (also known as a TEST STATISTIC) describes how many standard deviations of the sampling distribution a particular sample mean is from the population value: Test statistic for sample = Sample statistic value population true value Standard deviation of sampling distribution The sampling distribution will be described by the Standard Normal distribution (Table A) when involving means with KNOWN U -) test statistic is then called a z-statistic. 9; Do 01531 from Moore , p.372 (7'5 ed: 915.32 , p.369). Given population parameters are: Population mean, u = Population standard deviation, ct = Value of limit, above which it fails to meet the NOX requirement = a} Individual car that is at the limit in a population, (x=limit) z-score = Draw the standard curve and position this sample on it: Proportion (probability) of all cars that are at or EXCEED the limit = (Use the Standard Normal Curve . . . Table A, Moore inside back cover h) Sample that is the company car eet [n = 25) ...for sample mean, .1? = limit! Standardized score of the sample mean: z-statistic What is the probability that the average NO); level of this sample of cars exceeds limit? 15.31 Pollutants in auto exhausts. In 2017, the entire eet of lightduty vehicles sold in the United States by each manufacturer must emit an average of no more than 86 milligrams per mile (mg/ mi) of nitrogen oxides (NOX) : and nonmethane organic gas (NMOG) over the useful 5 life (150,000 miles of driving) of the vehicle. NOX + NMOG emissions over the useful life for one car model vary Normally with mean 80 mg/ mi and standard deviation 4 mg/ mi. Using this Normal distribution, the probabilities we want are P(3r'> 1.10 hours) = 0.2014 P()?> 1.25 hours) = 0.0182 Software gives these probabilities immediately, or you can standardize and use Table A. For example, _ --"1 1. 1 P(x>1.10)=P(X 1O) > 0.12 0.12 = P(Z > 0.83) = i - 0.7967 = 0.2033 with the usual roundoff error. Don't forget to use standard deviation 0.12 in your software or when you standardize )7. CONCLUDE: If you budget 1.1 hours per unit, there is a 20% chance that the techni- cians will not complete the work in the building within the budgeted time. This chance drops to 2% if you budget 1.25 hours. You should therefore budget 1.25 hours per unit.. Using more mathematics, we can start with the exponential distribution and find the actual density curve of SE for 70 observations. This is the dotted curve in Figure 15.6. You can see that the solid Normal curve is a good approximation. The exactly correct probability for 1.1 hours is an area to the right of 1.1 under the dotted den' sity curve. It is 0.1977. The central limit theorem Normal approximation 0.2014 is off by only about 0.004