Answered step by step
Verified Expert Solution
Link Copied!

Question

1 Approved Answer

Calibration curve In the calibration curve below the absorbance for the 2.0 mg/L standard appears to be too high. Which of the answer below is
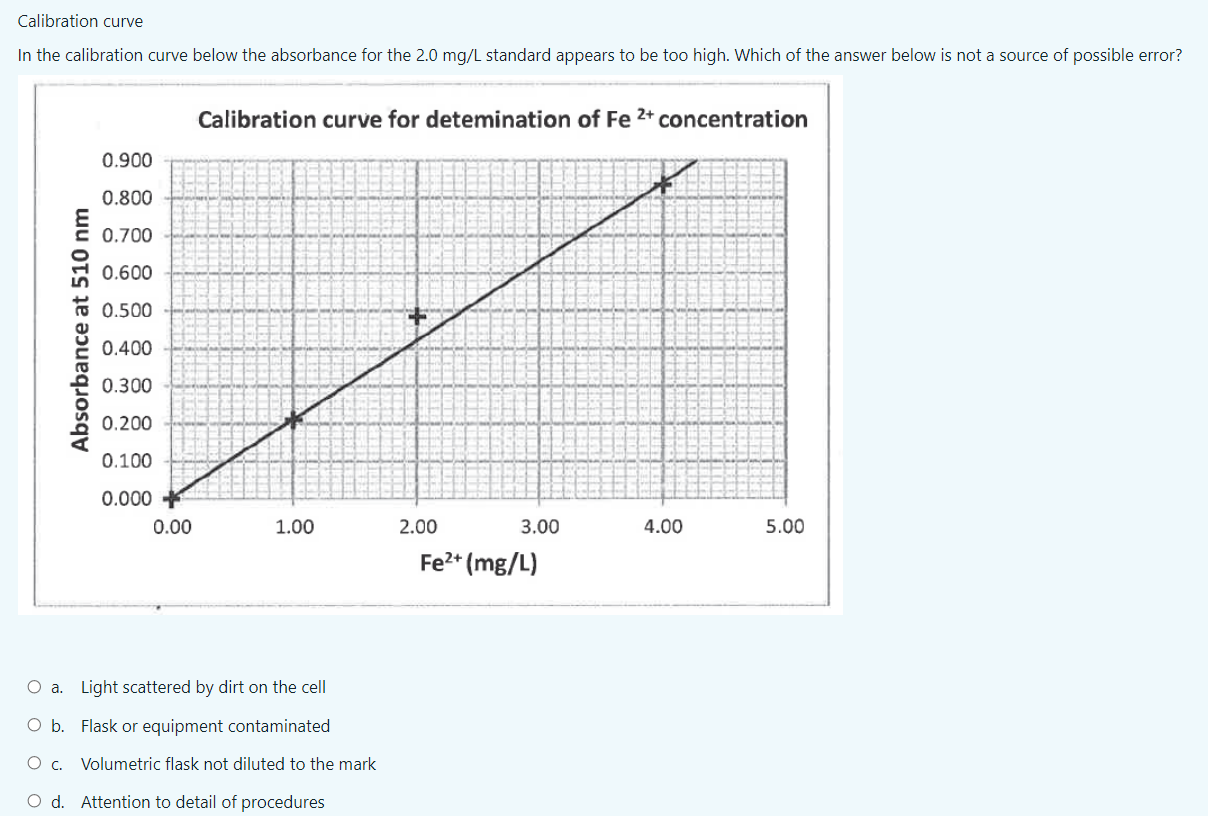
image text in transcribed

Calibration curve In the calibration curve below the absorbance for the 2.0 mg/L standard appears to be too high. Which of the answer below is not a source of possible error? Calibration curve for detemination of Fe 2+ concentration 0.900 0.800 0.700 0.600 0.500 Absorbance at 510 nm 0.400 0.300 0.200 0.100 0.000 + 0.00 1.00 2.00 3.00 4.00 5.00 Fe2+ (mg/L) O a Light scattered by dirt on the cell O b. Flask or equipment contaminated Oc. Volumetric flask not diluted to the mark O d. Attention to detail of procedures

Step by Step Solution

There are 3 Steps involved in it

Step: 1

blur-text-image

Get Instant Access to Expert-Tailored Solutions

See step-by-step solutions with expert insights and AI powered tools for academic success

Step: 2

blur-text-image

Step: 3

blur-text-image

Ace Your Homework with AI

Get the answers you need in no time with our AI-driven, step-by-step assistance

Get Started

Recommended Textbook for

Principles and Modern Applications of Mass Transfer Operations

Authors: Jaime Benitez

2nd edition

470181788, 470181782, 978-1-119-0427, 978-0470181782

More Books

Students also viewed these Chemical Engineering questions