can anyone solve it?
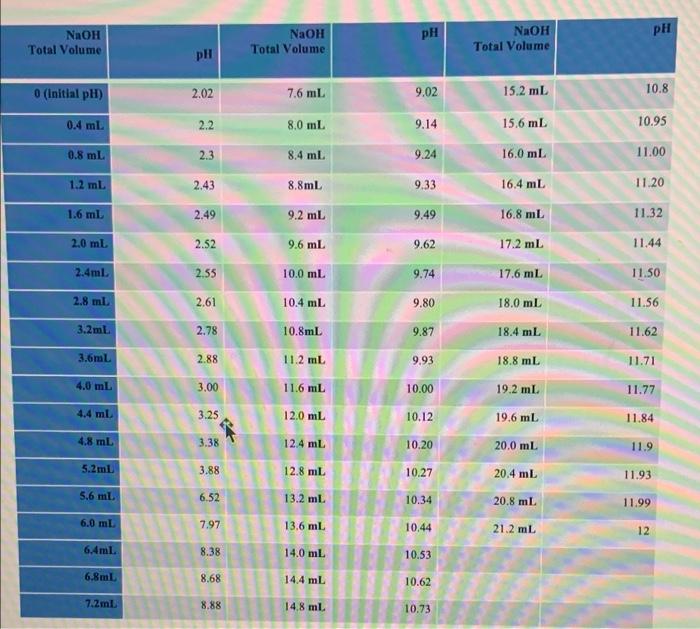
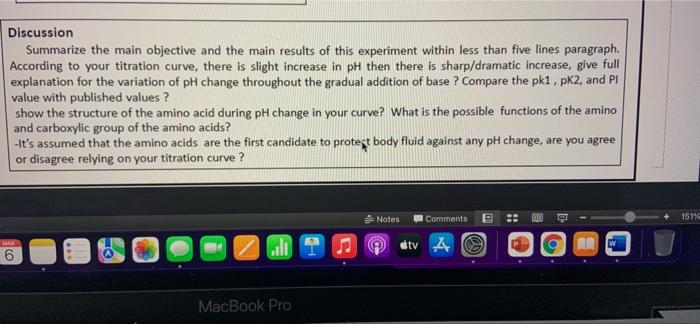
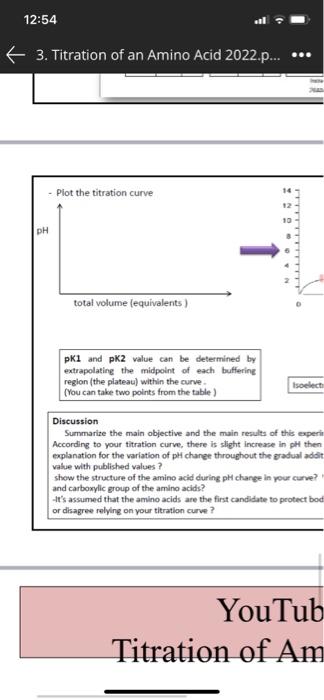
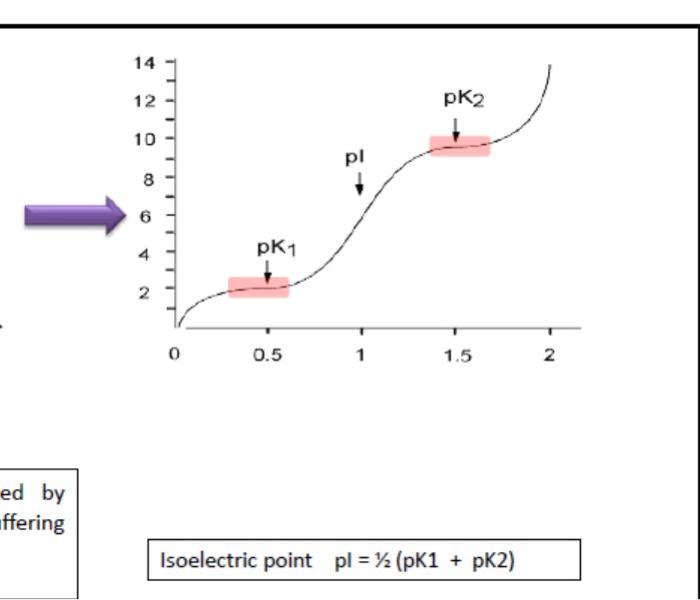
pH pH NaOH Total Volume NaOH Total Volume NaOH Total Volume pH 0 (Initial pH) 2.02 7.6 mL 9.02 15.2 mi. 10.8 0.4 ml 2.2 8,0 mL 9.14 15.6 mL 10.95 0.8 ml 2.3 8.4 ml 9.24 16.0 mL 11.00 1.2 ml 2.43 8.8ml 9.33 16.4 mL 11.20 1.6 ml 2.49 9.2 ml 9.49 16.8 ml 11.32 2.0 ml 2.52 9.6 ml 9.62 17.2 mL 11.44 2.4ml 2.55 10.0 mL 9.74 11.50 17.6 mL 18.0 mL 2.8 ml 2.61 10.4 mL 9.80 11.56 3.2mL 2.78 10.8mL 9.87 18.4 mL 11.62 3.6ml 2.88 11.2 ml. 9.93 18.8 mL 11.71 4.0 ml 3,00 11.6 mL 10.00 19.2 mL 11.77 4.4 ml 3.25 12.0 mL 10.12 19.6 mL 11.84 4.8 ml 3.38 12.4 ml 10.20 20.0 mL 11.9 5.2 m 3.88 12.8 ml 10.27 20.4 mL 11.93 5.6 ml 6.52 13.2 ml. 10.34 20.8 ml 11.99 6.0 ml 7.97 13.6 ml 10.44 21.2 mL 12 6.4ml 8.38 14.0 ml 10.53 6.8ml 8.68 14.4 mL 10.62 7.2ml 8.88 14,8 ml 10.73 Discussion Summarize the main objective and the main results of this experiment within less than five lines paragraph. According to your titration curve, there is slight increase in pH then there is sharp/dramatic increase, give full explanation for the variation of pH change throughout the gradual addition of base ? Compare the pk1, pk2, and PI value with published values ? show the structure of the amino acid during pH change in your curve? What is the possible functions of the amino and carboxylic group of the amino acids? -It's assumed that the amino acids are the first candidate to protet body fluid against any pH change, are you agree or disagree relying on your titration curve ? Notes Comments 151% 0) dtv A 9 g Ico MacBook Pro 12:54 3. Titration of an Amino Acid 2022.p... - Plot the titration curve pH total volume (equivalents) PKI and pk2 value can be determined by extrapolating the midpoint of each buffering region (the plateau) within the curve (You can take two points from the table) Isoelect Discussion Summarize the main objective and the main results of this experi According to your titration curve, there is slight increase in pH then explanation for the variation of pH change throughout the gradual adat value with published values ? show the structure of the amino acid during pH change in your curve? and carboxylic group of the amino acids? It's assumed that the amino acids are the first candidate to protect bod or disagree relying on your titration curve? YouTub Titration of Am 14 12 pk2 10 pl 8 PK1 0 0.5 1 1.5 2 N ed by offering Isoelectric point pl = 12 (pK1 + pK2)


