

Answered step by step
Verified Expert Solution
Question
1 Approved Answer
Can I get the solved version with screenshots for better understanding. Using the Solver add-in in Microsoft Excel, the Supply Chain Analytics Case Study Template,
Can I get the solved version with screenshots for better understanding.
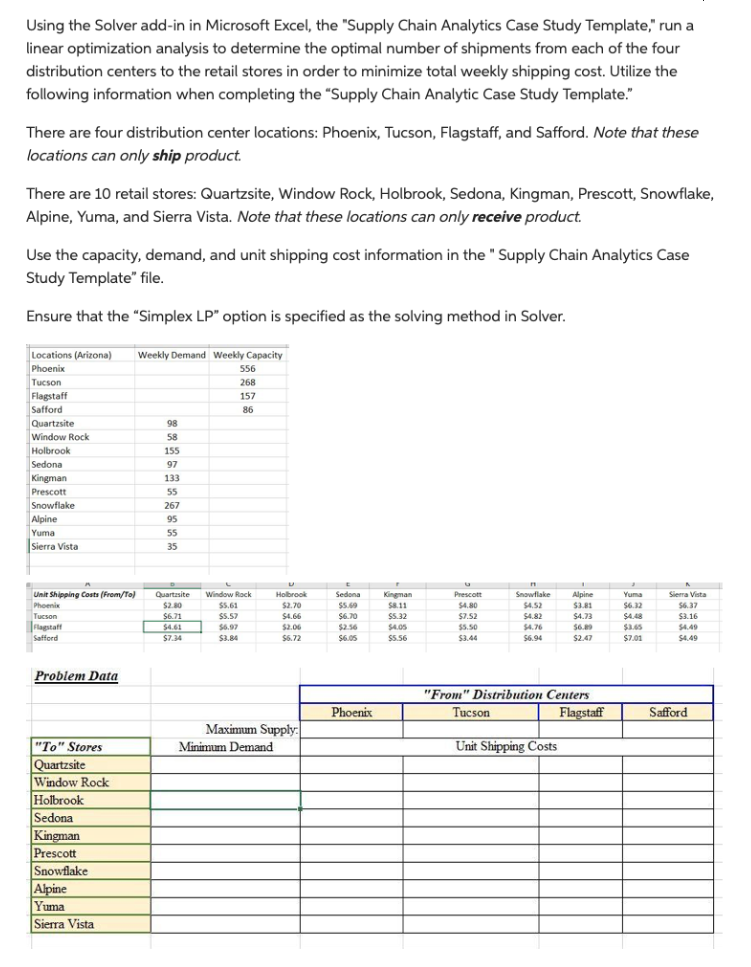
Using the Solver add-in in Microsoft Excel, the "Supply Chain Analytics Case Study Template," run a linear optimization analysis to determine the optimal number of shipments from each of the four distribution centers to the retail stores in order to minimize total weekly shipping cost. Utilize the following information when completing the "Supply Chain Analytic Case Study Template." There are four distribution center locations: Phoenix, Tucson, Flagstaff, and Safford. Note that these locations can only ship product. There are 10 retail stores: Quartzsite, Window Rock, Holbrook, Sedona, Kingman, Prescott, Snowflake, Alpine, Yuma, and Sierra Vista. Note that these locations can only receive product. Use the capacity, demand, and unit shipping cost information in the "Supply Chain Analytics Case Study Template" file. Ensure that the "Simplex LP" option is specified as the solving method in SolverStep by Step Solution
There are 3 Steps involved in it
Step: 1

Get Instant Access to Expert-Tailored Solutions
See step-by-step solutions with expert insights and AI powered tools for academic success
Step: 2

Step: 3
Ace Your Homework with AI
Get the answers you need in no time with our AI-driven, step-by-step assistance
Get Started
The Cryptoverse Understanding The Blockchain Bitcoin Ethereum And Co
Authors: Jonathan Geuter
1st Edition
979-8751163150