Can i have help answering these please


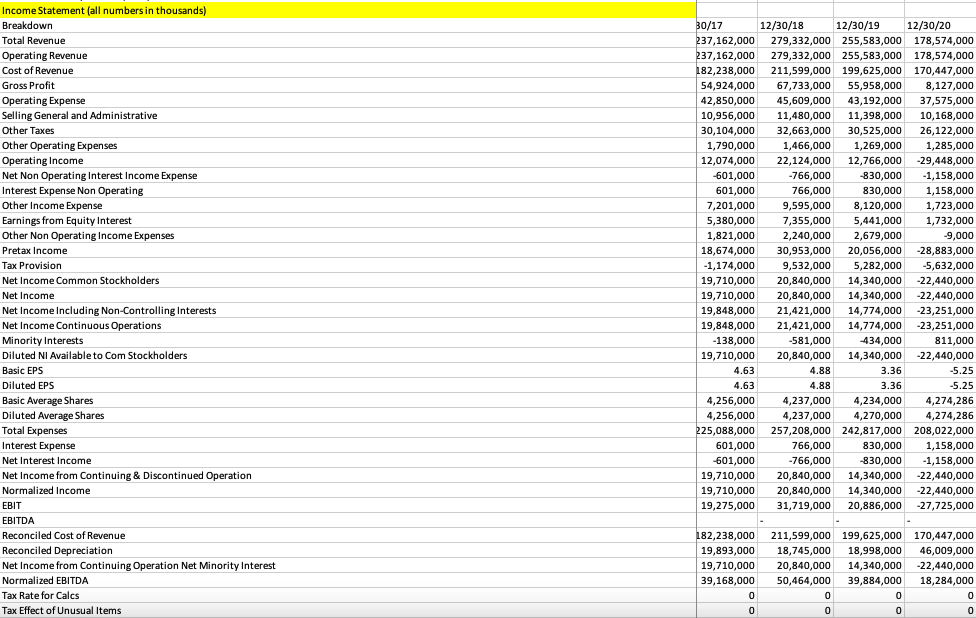
5 2 1 1 Qla Q1b Qic Qid Qle Q1f Qig Q1h Qli 1 4 1 2 Year (replace with your firm's year end dates) 30-Dec-17 30-Dec-18 30-Dec-19 30-Dec-20 30-Dec-21 30-Dec-22 30-Dec-23 30-Dec-24 30-Dec-25 Revenue growth rate (For past: calculate based on past revenues. For forecast: provide reasonable estimate. 17.7811% -8.5021% -30.1307% 58.9705% 0.8137% -7.7186% 5.4146% 5.2443% Revenue (For past: retrieve from P&L. For forecast: calculate based on growth rates) 37,162,000 279,332,000 255,583,000 178,574,000 283,880,000 286,190,000 264,100,000 278,400,000 293,000,000 Net Income (For past: retrieve from P&L. For forecast: calculate based on growth rates, or estimate based on forecast P&L done somewhere below line 115) 19,710,000 20,840,000 14,340,000 -22,440,000 Depreciation & amortisation expense (calculate based on growth rates, or estimate based on forecast P&L done somewhere below line 115) Tangible and intangible capital assets, carrying amount (For past: retrieve from balance sheet. For forecast: calculate based on growth rates, or estimate bastorecast balance sheet done somewhere below line 115) Capex (calculate based on above net capital assets and other items) Operating net working capital (For past: retrieve from balance sheet. For forecast: calculate based on growth rates, or estimate based on forecast balance shne somewhere below line 115) DeltaNWC (calculate based on above operating working capital and other items) Interest expense (calculate based on growth rates, or estimate based on forecast P&L done somewhere below line 115) tc, corporate tax rate (feel free to change this if you wish) 0.3 0.3 0.3 0.3 0.3 0.3 OFCF (calculate based on above items) 1 0.3 Q1j 4 -766,000 7,355,000 Income Statement (all numbers in thousands) Breakdown Total Revenue Operating Revenue Cost of Revenue Gross Profit Operating Expense Selling General and Administrative Other Taxes Other Operating Expenses Operating Income Net Non Operating Interest Income Expense Interest Expense Non Operating Other Income Expense Earnings from Equity Interest Other Non Operating Income Expenses Pretax Income Tax Provision Net Income Common Stockholders Net Income Net Income Including Non-Controlling Interests Net Income Continuous Operations Minority Interests Diluted NI Available to Com Stockholders Basic EPS Diluted EPS Basic Average Shares Diluted Average Shares Total Expenses Interest Expense Net Interest Income Net Income from Continuing & Discontinued Operation Normalized Income EBIT EBITDA Reconciled Cost of Revenue Reconciled Depreciation Net Income from Continuing Operation Net Minority Interest Normalized EBITDA Tax Rate for Calcs Tax Effect of Unusual Items 30/17 12/30/18 12/30/19 12/30/20 237,162,000 279,332,000 255,583,000 178,574,000 237,162,000 279,332,000 255,583,000 178,574,000 182,238,000 211,599,000 199,625,000 170,447,000 54,924,000 67,733,000 55,958,000 8,127,000 42,850,000 45,609,000 43,192,000 37,575,000 10,956,000 11,480,000 11,398,000 10,168,000 30,104,000 32,663,000 30,525,000 26,122,000 1,790,000 1,466,000 1,269,000 1,285,000 12,074,000 22,124,000 12,766,000 -29,448,000 -601,000 -830,000 -1,158,000 601,000 766,000 830,000 1,158,000 7,201,000 9,595,000 8,120,000 1,723,000 5,380,000 5,441,000 1,732,000 1,821,000 2,240,000 2,679,000 -9,000 18,674,000 30,953,000 20,056,000 -28,883,000 -1,174,000 9,532,000 5,282,000 -5,632,000 19,710,000 20,840,000 14,340,000 -22,440,000 19,710,000 20,840,000 14,340,000 -22,440,000 19,848,000 21,421,000 14,774,000 -23,251,000 19,848,000 21,421,000 14,774,000 -23,251,000 - 138,000 -581,000 434,000 811,000 19,710,000 20,840,000 14,340,000 -22,440,000 4.63 4.88 3.36 -5.25 4.63 4.88 3.36 -5.25 4,256,000 4,237,000 4,234,000 4,274,286 4,256,000 4,237,000 4,270,000 4,274,286 225,088,000 257,208,000 242,817,000 208,022,000 601,000 766,000 830,000 1,158,000 -601,000 -766,000 -830,000 -1,158,000 19,710,000 20,840,000 14,340,000 -22,440,000 19,710,000 20,840,000 14,340,000 -22,440,000 19,275,000 31,719,000 20,886,000 -27,725,000 182,238,000 19,893,000 19,710,000 39,168,000 0 0 211,599,000 199,625,000 170,447,000 18,745,000 18,998,000 46,009,000 20,840,000 14,340,000 -22,440,000 50,464,000 39,884,000 18,284,000 0 0 0 o 0 0 0 5 2 1 1 Qla Q1b Qic Qid Qle Q1f Qig Q1h Qli 1 4 1 2 Year (replace with your firm's year end dates) 30-Dec-17 30-Dec-18 30-Dec-19 30-Dec-20 30-Dec-21 30-Dec-22 30-Dec-23 30-Dec-24 30-Dec-25 Revenue growth rate (For past: calculate based on past revenues. For forecast: provide reasonable estimate. 17.7811% -8.5021% -30.1307% 58.9705% 0.8137% -7.7186% 5.4146% 5.2443% Revenue (For past: retrieve from P&L. For forecast: calculate based on growth rates) 37,162,000 279,332,000 255,583,000 178,574,000 283,880,000 286,190,000 264,100,000 278,400,000 293,000,000 Net Income (For past: retrieve from P&L. For forecast: calculate based on growth rates, or estimate based on forecast P&L done somewhere below line 115) 19,710,000 20,840,000 14,340,000 -22,440,000 Depreciation & amortisation expense (calculate based on growth rates, or estimate based on forecast P&L done somewhere below line 115) Tangible and intangible capital assets, carrying amount (For past: retrieve from balance sheet. For forecast: calculate based on growth rates, or estimate bastorecast balance sheet done somewhere below line 115) Capex (calculate based on above net capital assets and other items) Operating net working capital (For past: retrieve from balance sheet. For forecast: calculate based on growth rates, or estimate based on forecast balance shne somewhere below line 115) DeltaNWC (calculate based on above operating working capital and other items) Interest expense (calculate based on growth rates, or estimate based on forecast P&L done somewhere below line 115) tc, corporate tax rate (feel free to change this if you wish) 0.3 0.3 0.3 0.3 0.3 0.3 OFCF (calculate based on above items) 1 0.3 Q1j 4 -766,000 7,355,000 Income Statement (all numbers in thousands) Breakdown Total Revenue Operating Revenue Cost of Revenue Gross Profit Operating Expense Selling General and Administrative Other Taxes Other Operating Expenses Operating Income Net Non Operating Interest Income Expense Interest Expense Non Operating Other Income Expense Earnings from Equity Interest Other Non Operating Income Expenses Pretax Income Tax Provision Net Income Common Stockholders Net Income Net Income Including Non-Controlling Interests Net Income Continuous Operations Minority Interests Diluted NI Available to Com Stockholders Basic EPS Diluted EPS Basic Average Shares Diluted Average Shares Total Expenses Interest Expense Net Interest Income Net Income from Continuing & Discontinued Operation Normalized Income EBIT EBITDA Reconciled Cost of Revenue Reconciled Depreciation Net Income from Continuing Operation Net Minority Interest Normalized EBITDA Tax Rate for Calcs Tax Effect of Unusual Items 30/17 12/30/18 12/30/19 12/30/20 237,162,000 279,332,000 255,583,000 178,574,000 237,162,000 279,332,000 255,583,000 178,574,000 182,238,000 211,599,000 199,625,000 170,447,000 54,924,000 67,733,000 55,958,000 8,127,000 42,850,000 45,609,000 43,192,000 37,575,000 10,956,000 11,480,000 11,398,000 10,168,000 30,104,000 32,663,000 30,525,000 26,122,000 1,790,000 1,466,000 1,269,000 1,285,000 12,074,000 22,124,000 12,766,000 -29,448,000 -601,000 -830,000 -1,158,000 601,000 766,000 830,000 1,158,000 7,201,000 9,595,000 8,120,000 1,723,000 5,380,000 5,441,000 1,732,000 1,821,000 2,240,000 2,679,000 -9,000 18,674,000 30,953,000 20,056,000 -28,883,000 -1,174,000 9,532,000 5,282,000 -5,632,000 19,710,000 20,840,000 14,340,000 -22,440,000 19,710,000 20,840,000 14,340,000 -22,440,000 19,848,000 21,421,000 14,774,000 -23,251,000 19,848,000 21,421,000 14,774,000 -23,251,000 - 138,000 -581,000 434,000 811,000 19,710,000 20,840,000 14,340,000 -22,440,000 4.63 4.88 3.36 -5.25 4.63 4.88 3.36 -5.25 4,256,000 4,237,000 4,234,000 4,274,286 4,256,000 4,237,000 4,270,000 4,274,286 225,088,000 257,208,000 242,817,000 208,022,000 601,000 766,000 830,000 1,158,000 -601,000 -766,000 -830,000 -1,158,000 19,710,000 20,840,000 14,340,000 -22,440,000 19,710,000 20,840,000 14,340,000 -22,440,000 19,275,000 31,719,000 20,886,000 -27,725,000 182,238,000 19,893,000 19,710,000 39,168,000 0 0 211,599,000 199,625,000 170,447,000 18,745,000 18,998,000 46,009,000 20,840,000 14,340,000 -22,440,000 50,464,000 39,884,000 18,284,000 0 0 0 o 0 0 0


