Answered step by step
Verified Expert Solution
Question
1 Approved Answer
Can someone help me create a ratio table for Home Depot using 2019's data? The income statements and balance sheet is attached. I have also
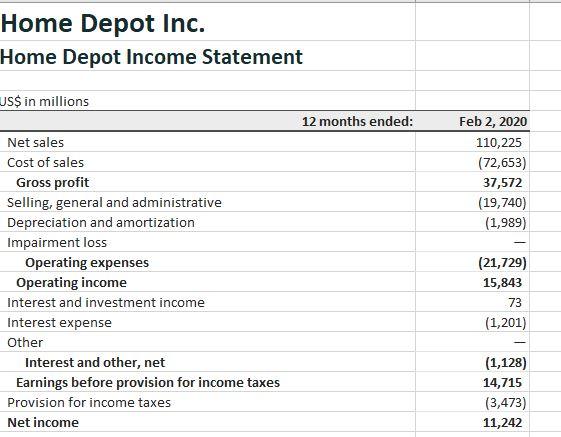
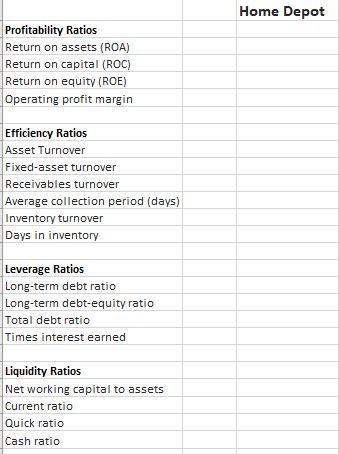
Can someone help me create a ratio table for Home Depot using 2019's data? The income statements and balance sheet is attached. I have also attached what I need to fill out.
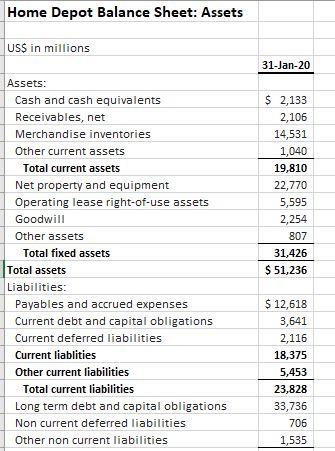
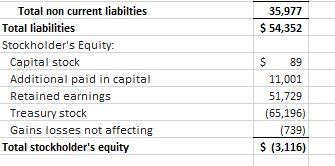
Home Depot Balance Sheet: Assets US$ in millions 31-Jan-20 Assets: Cash and cash equivalents Receivables, net Merchandise inventories Other current assets Total current assets Net property and equipment Operating lease right-of-use assets Goodwill Other assets Total fixed assets Total assets Liabilities: Payables and accrued expenses Current debt and capital obligations Current deferred liabilities Current liablities Other current liabilities Total current liabilities Long term debt and capital obligations Non current deferred liabilities Other non current liabilities $ 2,133 2,106 14,531 1,040 19,810 22,770 5,595 2,254 807 31,426 $ 51,236 $ 12,618 3,641 2,116 18,375 5,453 23,828 33,736 706 1,535 35,977 $ 54,352 Total non current liabilties Total liabilities Stockholder's Equity: Capital stock Additional paid in capital Retained earnings Treasury stock Gains losses not affecting Total stockholder's equity $ 89 11,001 51,729 (65,196) (739) $ (3,116) Home Depot Inc. Home Depot Income Statement US$ in millions 12 months ended: Feb 2, 2020 110,225 (72,653) 37,572 (19,740) (1,989) Net sales Cost of sales Gross profit Selling, general and administrative Depreciation and amortization Impairment loss Operating expenses Operating income Interest and investment income Interest expense Other Interest and other, net Earnings before provision for income taxes Provision for income taxes Net income (21,729) 15,843 73 (1,201) (1,128) 14,715 (3,473) 11,242 Home Depot Profitability Ratios Return on assets (ROA) Return on capital (ROC) Return on equity (ROE) Operating profit margin Efficiency Ratios Asset Turnover Fixed-asset turnover Receivables turnover Average collection period (days) Inventory turnover Days in inventory Leverage Ratios Long-term debt ratio Long-term debt-equity ratio Total debt ratio Times interest earned Liquidity Ratios Net working capital to assets Current ratio Quick ratio Cash ratio
Step by Step Solution
There are 3 Steps involved in it
Step: 1
Get Instant Access to Expert-Tailored Solutions
See step-by-step solutions with expert insights and AI powered tools for academic success
Step: 2
Step: 3
Ace Your Homework with AI
Get the answers you need in no time with our AI-driven, step-by-step assistance
Get Started