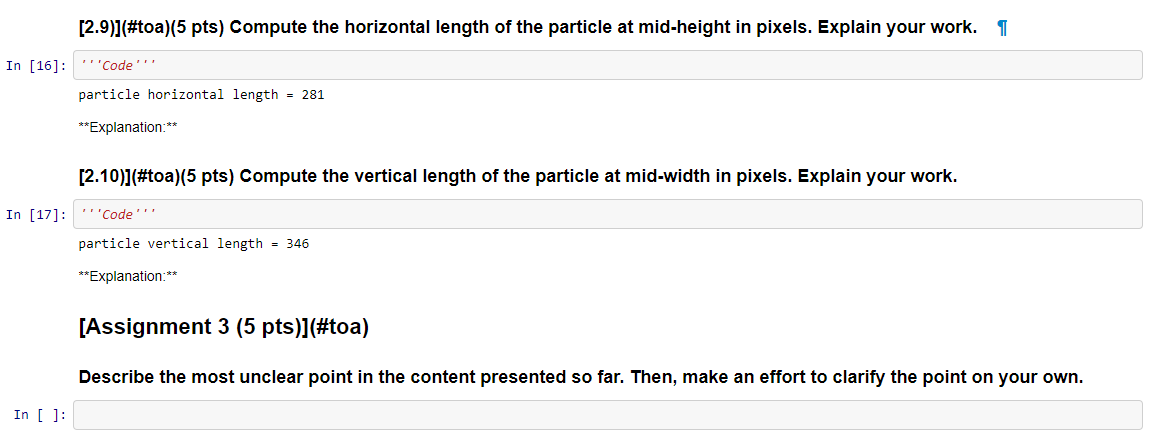
Can someone help me solve 2.9 and 2.10?
when calculating horizontal or vertical mid-height of which line green or red or black then using all threeway
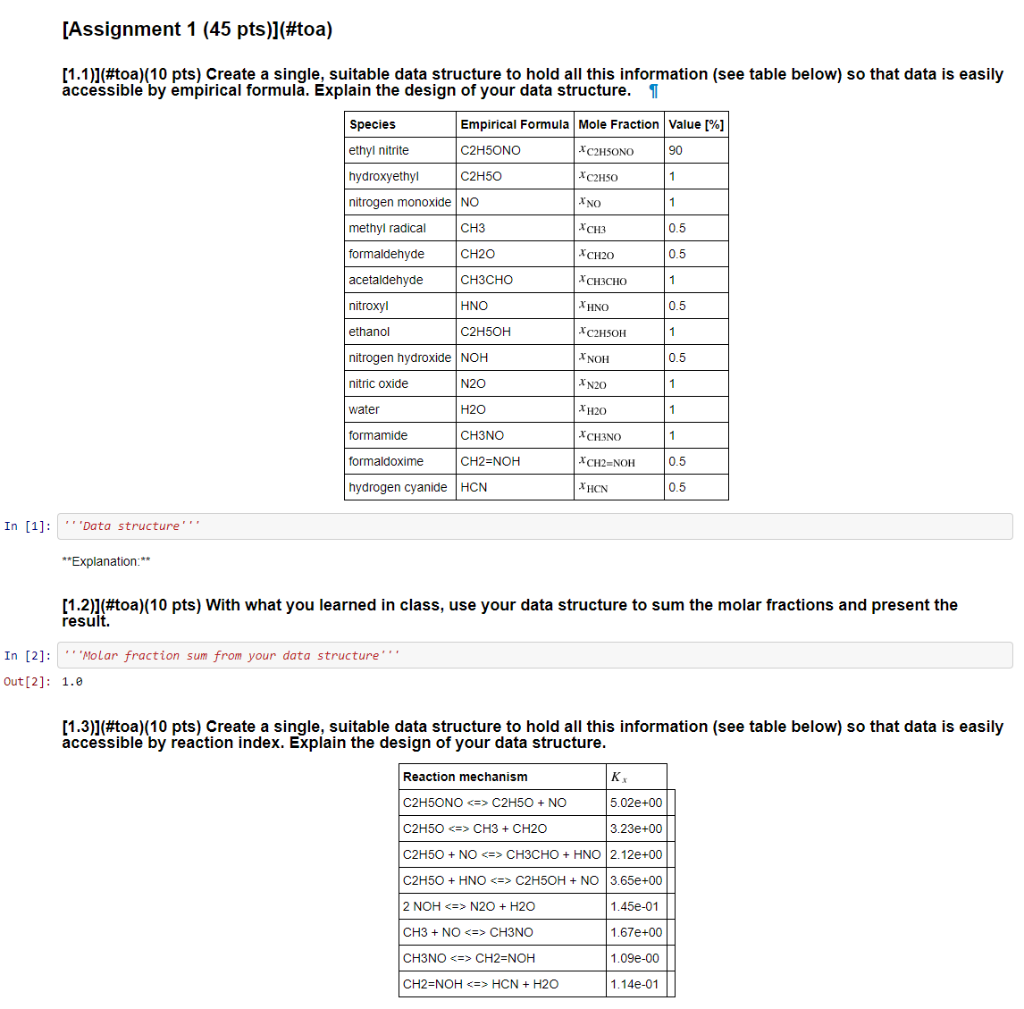
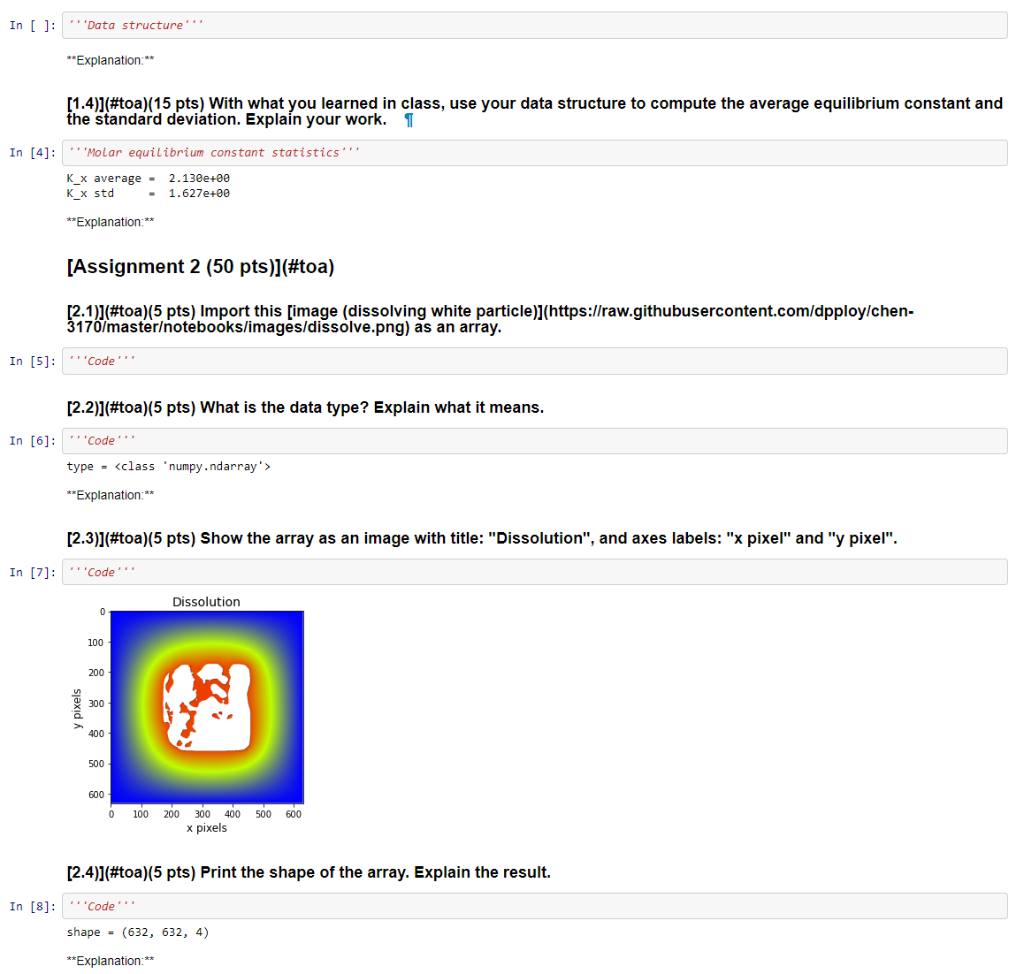
[Assignment 1 (45 pts)](#toa) (1.1)](#toa)(10 pts) Create a single, suitable data structure to hold all this information (see table below) so that data is easily accessible by empirical formula. Explain the design of your data structure. 1 Species Empirical Formula Mole Fraction value [%] ethyl nitrite C2H5ONO *C2H5ONO 90 hydroxyethyl C2H50 C2H50 1 nitrogen monoxide NO 1 methyl radical CH3 XCH3 0.5 formaldehyde CH20 XCH20 0.5 acetaldehyde CH3CHO 1 nitroxyl | HNO 0.5 ethanol C2H5OH C2H5OH 1 nitrogen hydroxide NOH NOH 0.5 nitric oxide N2O XN20 1 water H2O XH2O 1 formamide CH3NO CH3NO 1 formaldoxime CH2=NOH XCH2=NO 0.5 hydrogen cyanide HCN XHCN 0.5 In [1]: Data structure'' **Explanation: (1.2)](#toa)(10 pts) With what you learned in class, use your data structure to sum the molar fractions and present the result. In [2]: " 'Molar fraction sum from your data structure Out[2]: 1.0 [1.3)](#toa)(10 pts) Create a single, suitable data structure to hold all this information (see table below) so that data is easily accessible by reaction index. Explain the design of your data structure. Reaction mechanism K C2H5ONO C2H50 + NO 5.02e+00 C2H50 CH3 + CH2O 3.23e+00 C2H50 + NO CH3CHO + HNO 2.12e+00 C2H50 + HNO C2H5OH + NO 3.65e+00 2 NOH N2O + H2O 1.45e-01 CH3 + NO CH3NO 1.67e+00 CH3NO CH2=NOH 1.09e-00 [CH2=NOH HCN + H2O 1.14e-01 In [ ]: ''Data structure **Explanation:** [1.4)](#toa)(15 pts) With what you learned in class, use your data structure to compute the average equilibrium constant and the standard deviation. Explain your work. 1 In [4]: 'Molar equilibrium constant statistics K_X average - 2.130e+00 K_x std 1.627e+00 **Explanation:** [Assignment 2 (50 pts)](#toa) [2.1]](#toa)(5 pts) Import this [image (dissolving white particle)](https://raw.githubusercontent.com/dpploy/chen- 3170/masterotebooks/images/dissolve.png) as an array. In [5]: ''Code' [2.2)](#toa)(5 pts) What is the data type? Explain what it means. In [6]: Code type -
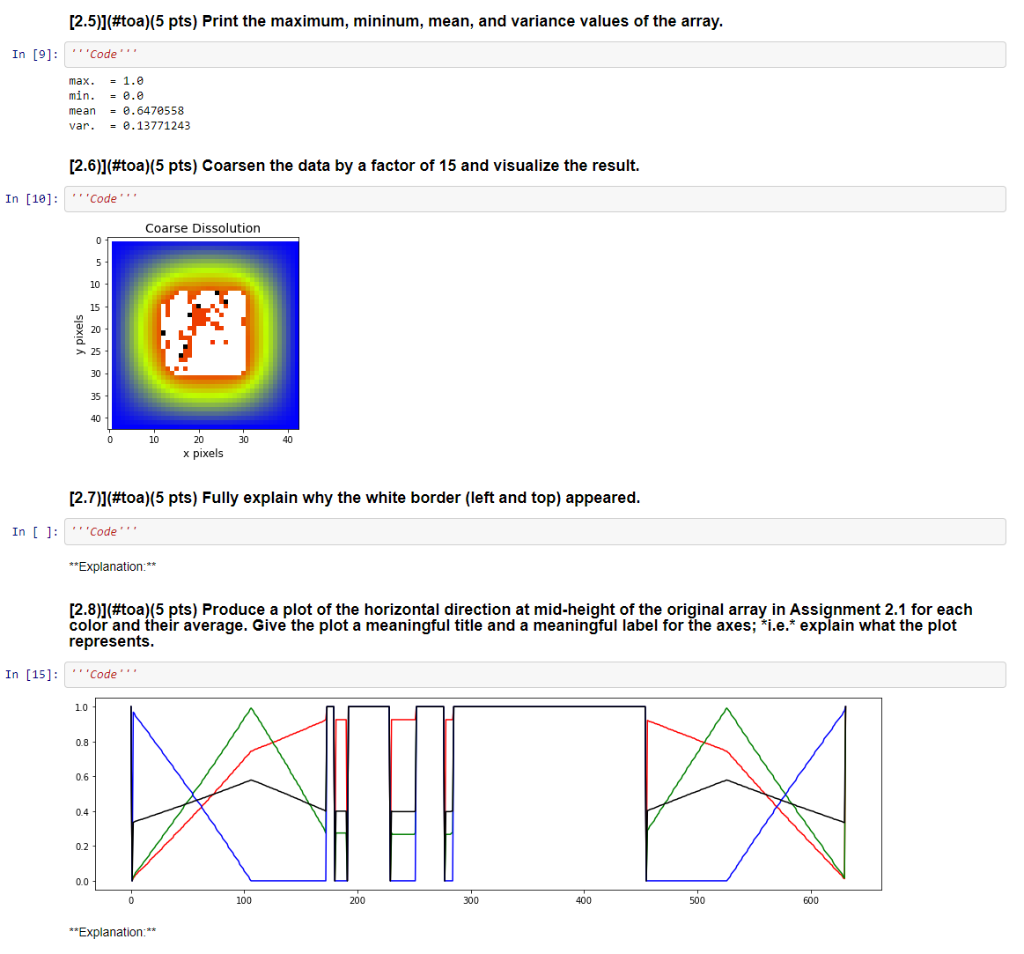
**Explanation:** [2.3)](#toa)(5 pts) Show the array as an image with title: "Dissolution", and axes labels: "x pixel" and "y pixel". In [7]: Code Dissolution 0 100 200 200 400 500 600 0 100 200 300 400 500 600 x pixels [2.4)](#toa)(5 pts) Print the shape of the array. Explain the result. In [8]: Code shape - (632, 632, 4) **Explanation:** [2.5)](#toa)(5 pts) Print the maximum, mininum, mean, and variance values of the array. In [9]: ''Code. max. = 1.0 min. = 0.0 mean = 0.6470558 var. = 6.13771243 [2.6)](#toa)(5 pts) Coarsen the data by a factor of 15 and visualize the result. In [18]: Code Coarse Dissolution 0 5 10 15 20 25 30 35 40 0 10 30 40 20 x pixels [2.7)](#toa)(5 pts) Fully explain why the white border (left and top) appeared. In [ ]: ''Code **Explanation:** [2.8)](#toa)(5 pts) Produce a plot of the horizontal direction at mid-height of the original array in Assignment 2.1 for each color and their average. Give the plot a meaningful title and a meaningful label for the axes; *i.e.* explain what the plot represents. In [15]: ''Code. 10 0.8 0.6 0.4 0.2 0.0 100 200 300 400 500 600 **Explanation:** [2.9)](#toa)(5 pts) Compute the horizontal length of the particle at mid-height in pixels. Explain your work. 1 In [16]: 'Code particle horizontal length = 281 **Explanation:** [2.10)](#toa)(5 pts) Compute the vertical length of the particle at mid-width in pixels. Explain your work. In [17]: 'Code' particle vertical length = 346 **Explanation:** [Assignment 3 (5 pts)](#toa) Describe the most unclear point in the content presented so far. Then, make an effort to clarify the point on your own. In [ ]: [Assignment 1 (45 pts)](#toa) (1.1)](#toa)(10 pts) Create a single, suitable data structure to hold all this information (see table below) so that data is easily accessible by empirical formula. Explain the design of your data structure. 1 Species Empirical Formula Mole Fraction value [%] ethyl nitrite C2H5ONO *C2H5ONO 90 hydroxyethyl C2H50 C2H50 1 nitrogen monoxide NO 1 methyl radical CH3 XCH3 0.5 formaldehyde CH20 XCH20 0.5 acetaldehyde CH3CHO 1 nitroxyl | HNO 0.5 ethanol C2H5OH C2H5OH 1 nitrogen hydroxide NOH NOH 0.5 nitric oxide N2O XN20 1 water H2O XH2O 1 formamide CH3NO CH3NO 1 formaldoxime CH2=NOH XCH2=NO 0.5 hydrogen cyanide HCN XHCN 0.5 In [1]: Data structure'' **Explanation: (1.2)](#toa)(10 pts) With what you learned in class, use your data structure to sum the molar fractions and present the result. In [2]: " 'Molar fraction sum from your data structure Out[2]: 1.0 [1.3)](#toa)(10 pts) Create a single, suitable data structure to hold all this information (see table below) so that data is easily accessible by reaction index. Explain the design of your data structure. Reaction mechanism K C2H5ONO C2H50 + NO 5.02e+00 C2H50 CH3 + CH2O 3.23e+00 C2H50 + NO CH3CHO + HNO 2.12e+00 C2H50 + HNO C2H5OH + NO 3.65e+00 2 NOH N2O + H2O 1.45e-01 CH3 + NO CH3NO 1.67e+00 CH3NO CH2=NOH 1.09e-00 [CH2=NOH HCN + H2O 1.14e-01 In [ ]: ''Data structure **Explanation:** [1.4)](#toa)(15 pts) With what you learned in class, use your data structure to compute the average equilibrium constant and the standard deviation. Explain your work. 1 In [4]: 'Molar equilibrium constant statistics K_X average - 2.130e+00 K_x std 1.627e+00 **Explanation:** [Assignment 2 (50 pts)](#toa) [2.1]](#toa)(5 pts) Import this [image (dissolving white particle)](https://raw.githubusercontent.com/dpploy/chen- 3170/masterotebooks/images/dissolve.png) as an array. In [5]: ''Code' [2.2)](#toa)(5 pts) What is the data type? Explain what it means. In [6]: Code type - **Explanation:** [2.3)](#toa)(5 pts) Show the array as an image with title: "Dissolution", and axes labels: "x pixel" and "y pixel". In [7]: Code Dissolution 0 100 200 200 400 500 600 0 100 200 300 400 500 600 x pixels [2.4)](#toa)(5 pts) Print the shape of the array. Explain the result. In [8]: Code shape - (632, 632, 4) **Explanation:** [2.5)](#toa)(5 pts) Print the maximum, mininum, mean, and variance values of the array. In [9]: ''Code. max. = 1.0 min. = 0.0 mean = 0.6470558 var. = 6.13771243 [2.6)](#toa)(5 pts) Coarsen the data by a factor of 15 and visualize the result. In [18]: Code Coarse Dissolution 0 5 10 15 20 25 30 35 40 0 10 30 40 20 x pixels [2.7)](#toa)(5 pts) Fully explain why the white border (left and top) appeared. In [ ]: ''Code **Explanation:** [2.8)](#toa)(5 pts) Produce a plot of the horizontal direction at mid-height of the original array in Assignment 2.1 for each color and their average. Give the plot a meaningful title and a meaningful label for the axes; *i.e.* explain what the plot represents. In [15]: ''Code. 10 0.8 0.6 0.4 0.2 0.0 100 200 300 400 500 600 **Explanation:** [2.9)](#toa)(5 pts) Compute the horizontal length of the particle at mid-height in pixels. Explain your work. 1 In [16]: 'Code particle horizontal length = 281 **Explanation:** [2.10)](#toa)(5 pts) Compute the vertical length of the particle at mid-width in pixels. Explain your work. In [17]: 'Code' particle vertical length = 346 **Explanation:** [Assignment 3 (5 pts)](#toa) Describe the most unclear point in the content presented so far. Then, make an effort to clarify the point on your own. In [ ]


