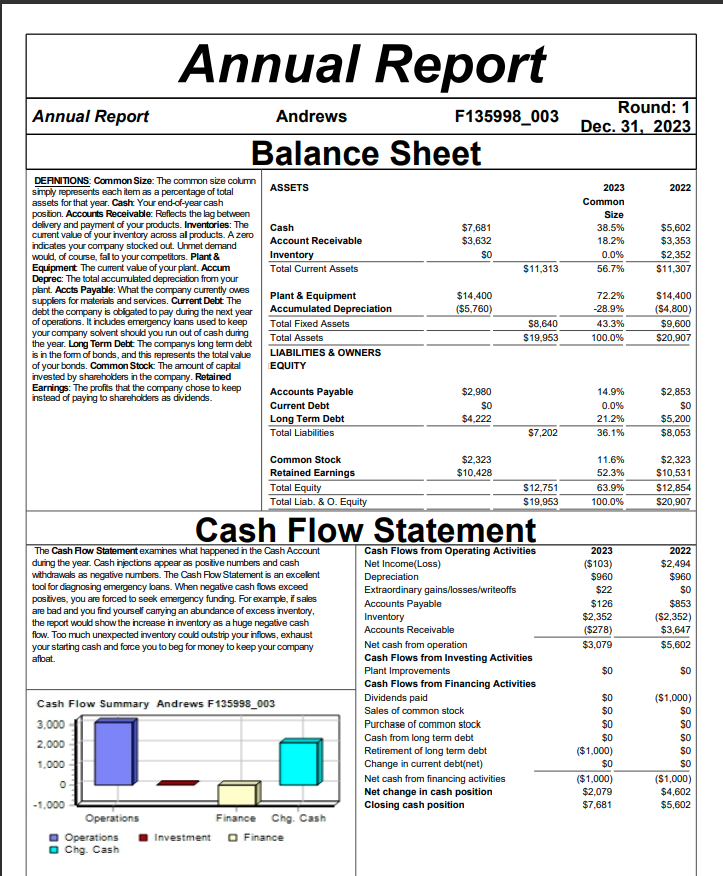
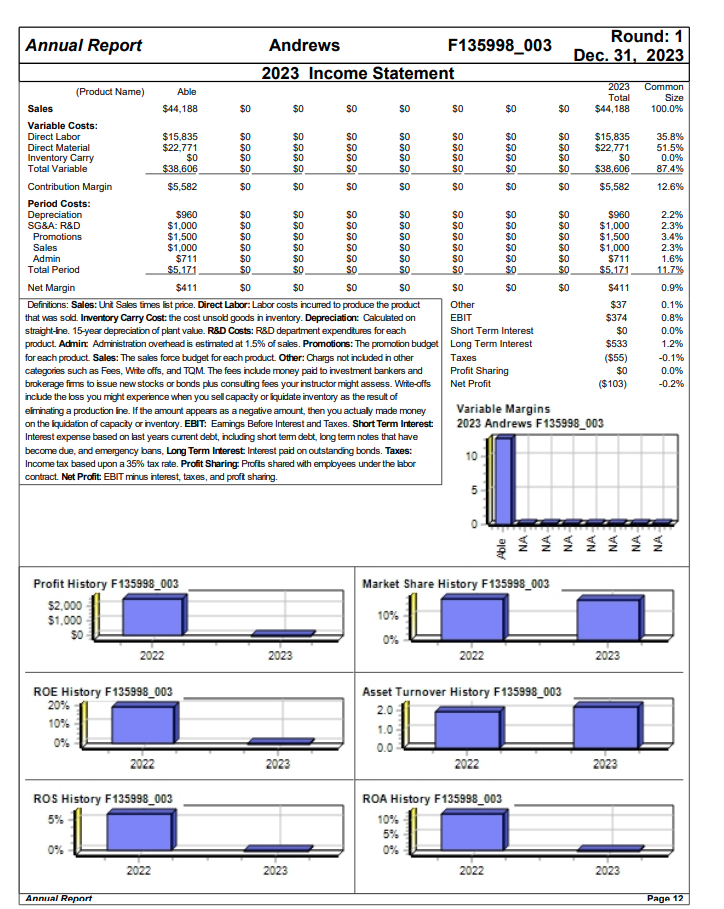
Can someone help me understand where I went wrong in my calculations more specifically, my net profit being negative? I am under ABLE/ Andrews
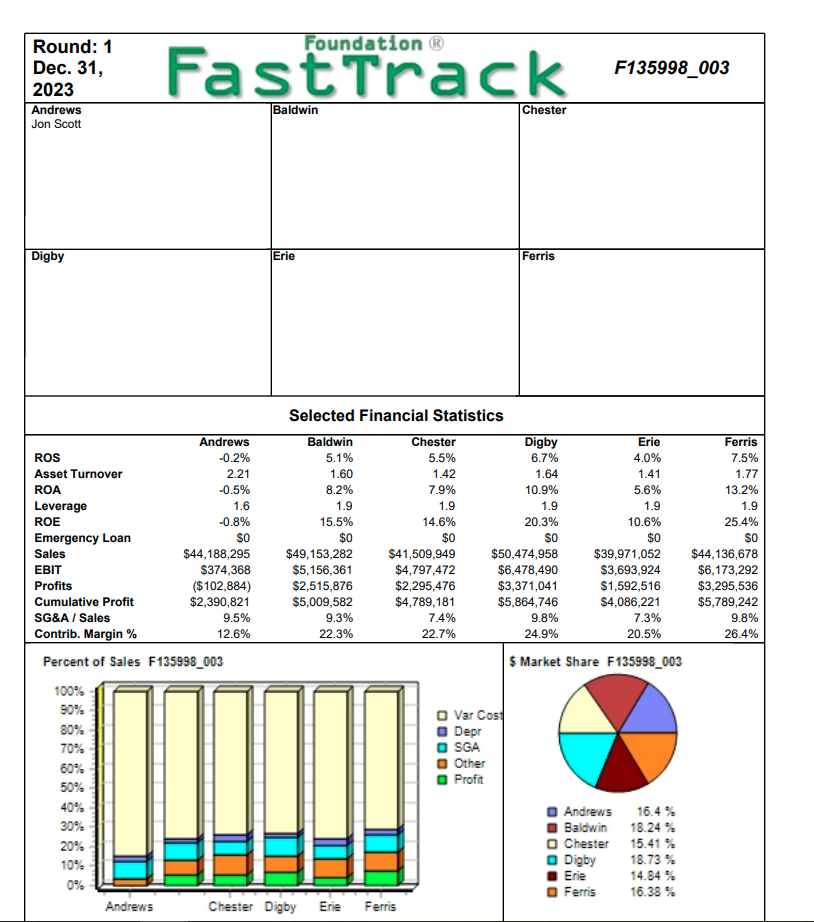
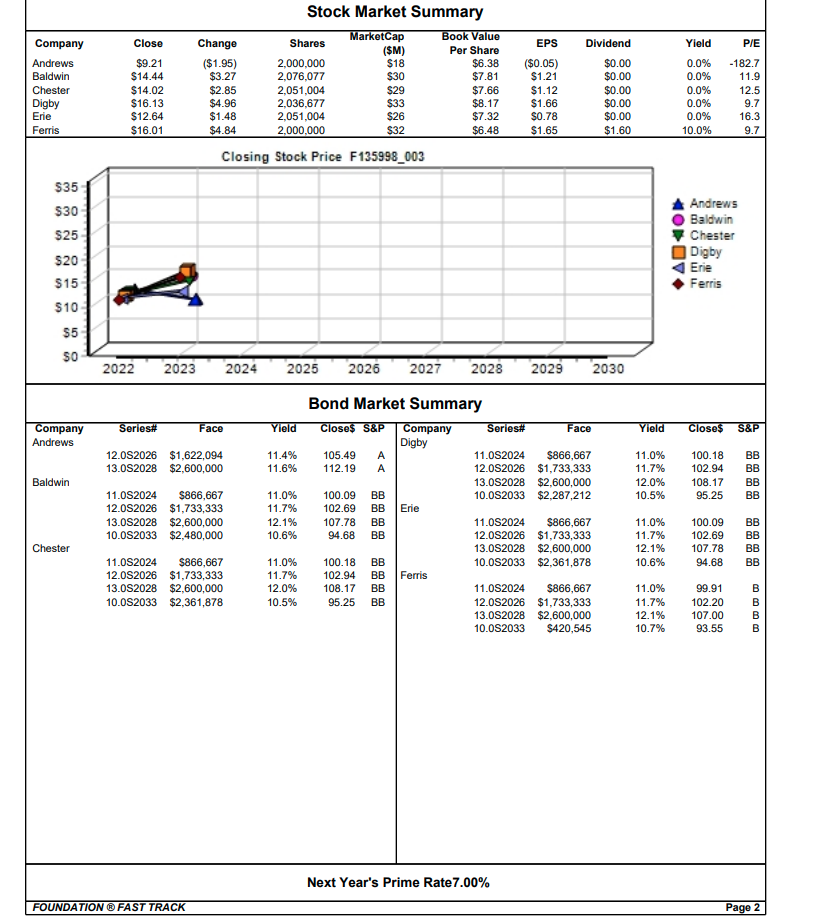
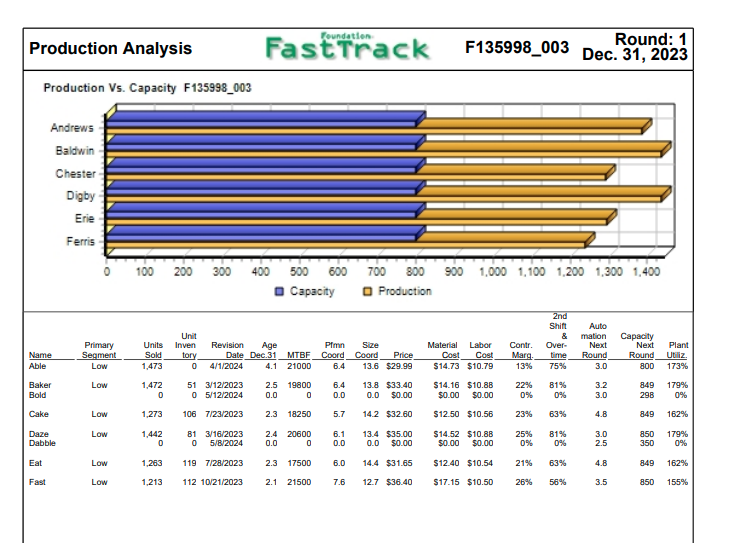
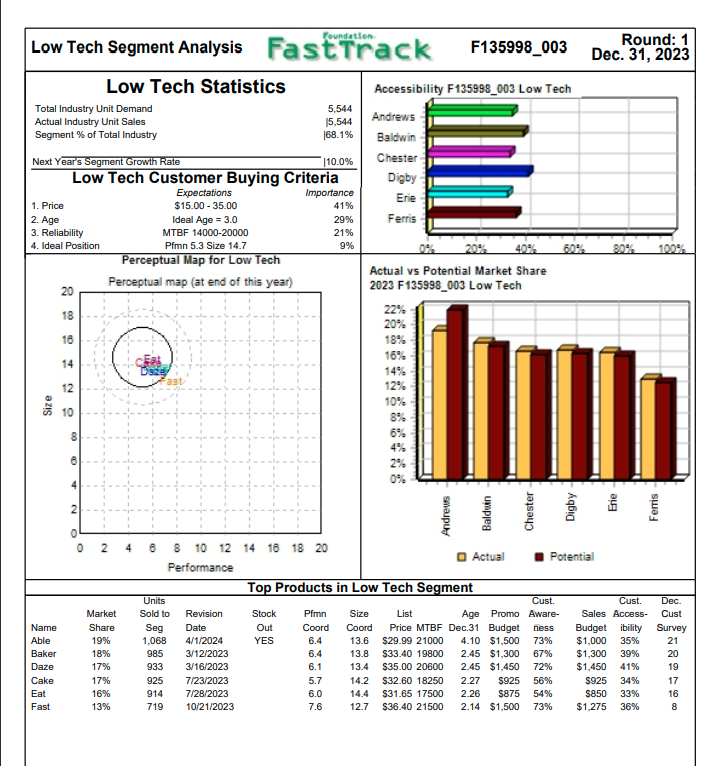
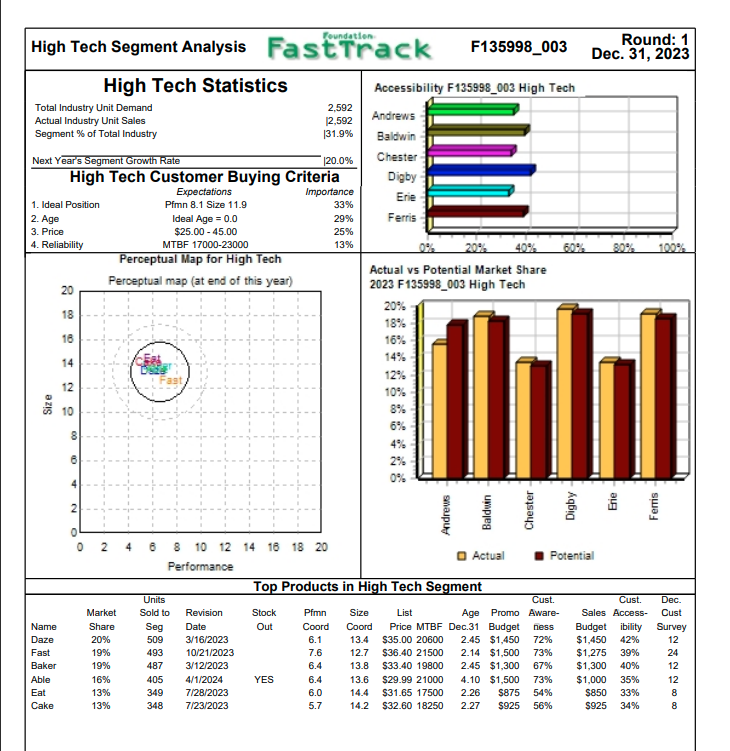
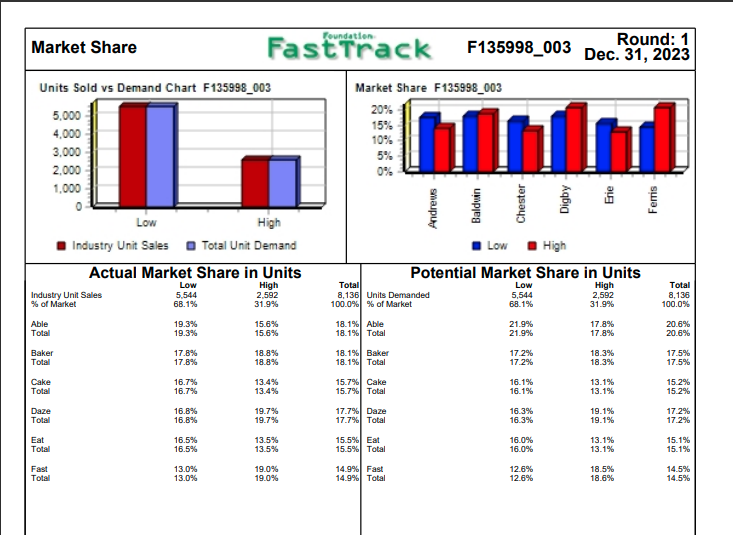
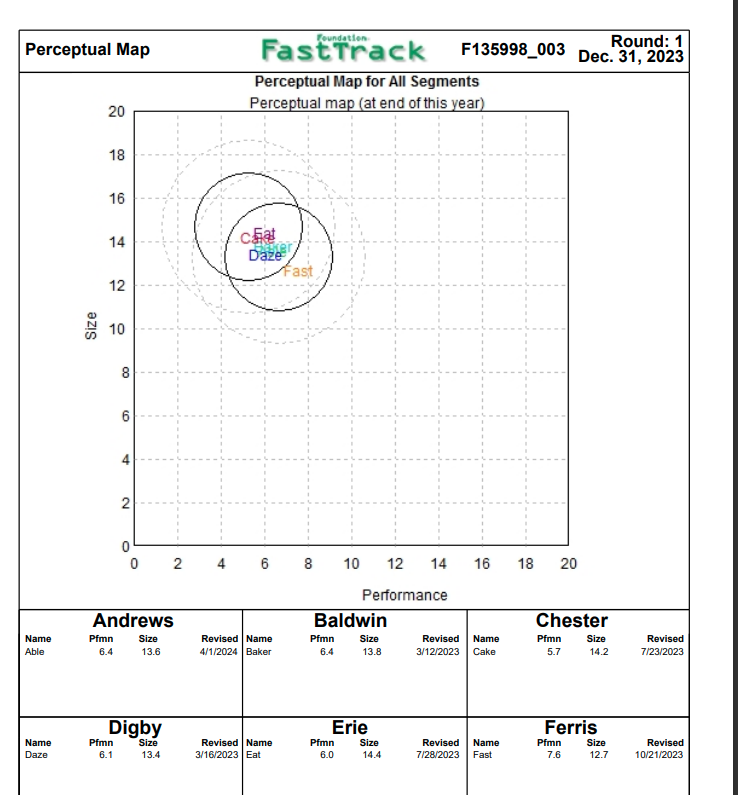
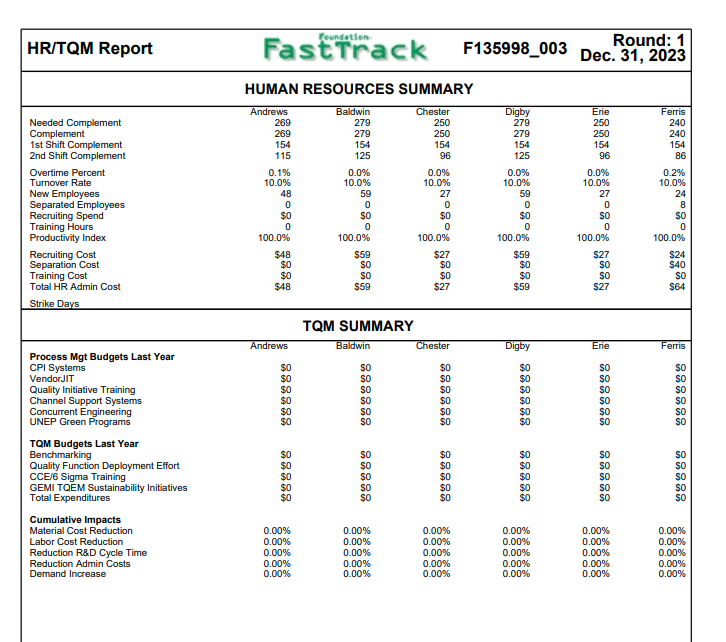
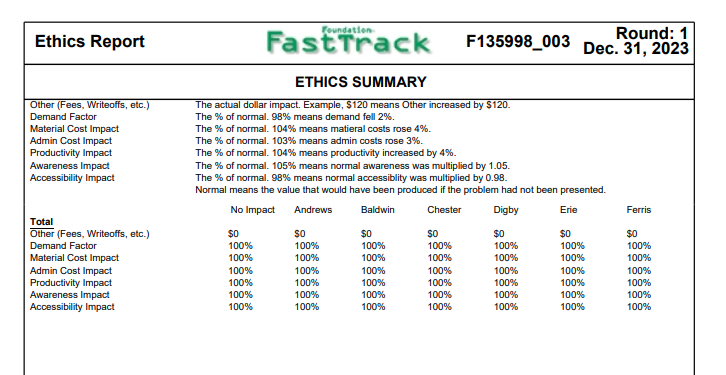
Foundation Round: 1 Dec. 31, 2023 Andrews Jon Scott FastTrack F135998_003 Baldwin Chester Digby Erie Ferris Selected Financial Statistics Andrews ROS -0.2% Asset Turnover 2.21 ROA -0.5% Leverage 1.6 ROE -0.8% Emergency Loan SO Sales $44,188,295 EBIT $374,368 Profits ($102,884) Cumulative Profit $2,390,821 SG&A / Sales 9.5% Contrib. Margin% 12.6% Percent of Sales F135998_003 Baldwin 5.1% 1.60 8.2% 1.9 15.5% $0 $49,153,282 $5,156,361 $2,515,876 $5,009,582 9.3% 22.3% Chester 5.5% 1.42 7.9% 1.9 14.6% $0 $41,509,949 $4,797,472 $2,295,476 $4,789,181 7.4% 22.7% Digby 6.7% 1.64 10.9% 1.9 20.3% $0 $50,474,958 $6,478,490 $3,371,041 $5,864,746 9.8% 24.9% Erie 4.0% 1.41 5.6% 1.9 10.6% $0 $39,971,052 $3,693,924 $1,592,516 $4,086,221 7.3% 20.5% Ferris 7.5% 1.77 13.2% 1.9 25.4% $0 $44, 136,678 $6,173,292 $3,295,536 $5,789,242 9.8% 26.4% S Market Share F135998_003 100% Var Cost Depr O SGA Other Profit 90% 80% 70% 60% 50% 40% 30% 20% 10% Andrews 16.4% Baldwin 18.24% Chester 15.41 % Digby 18.73% Erie 14.84 % Ferris 16.38% Andrews Chester Digby Erie Ferris Close EPS Dividend Yield PIE Company Andrews Baldwin Chester Digby Erie Ferris $9.21 $14.44 $14.02 $16.13 $12.64 $16.01 Stock Market Summary Book Value MarketCap Change Shares ($M) Per Share ($1.95) 2,000,000 $18 $6.38 $3.27 2,076,077 $30 $7.81 $2.85 2,051,004 $29 $7.66 $4.96 2,036,677 $33 $8.17 $1.48 2,051,004 $26 $7.32 $4.84 2,000,000 $32 $6.48 Closing Stock Price F135998_003 ($0.05) $1.21 $1.12 $1.66 $0.78 $1.65 $0.00 $0.00 $0.00 $0.00 $0.00 $1.60 0.0% 0.0% 0.0% 0.0% 0.0% 10.0% -182.7 11.9 12.5 9.7 16.3 9.7 $35 $30 $25 Andrews Baldwin Chester Digby Erie Ferris $20 $15 $10 S5 SO 2022 2023 2024 2025 2026 2027 2028 2029 2030 Series# Face Yield Yield Closes S&P Company Andrews 12.0S2026 $1,622,094 13.0S2028 $2,600,000 11.4% 11.6% Baldwin 11.0% 11.7% 12.0% 10.5% 100.18 102.94 108.17 95.25 BB BB BB BB 11.082024 $866,667 12.082026 $1,733,333 13.0S2028 $2,600,000 10.082033 $2,480,000 11.0% 11.7% 12.1% 10.6% Bond Market Summary Close$ S&P Company Series# Face Digby 105.49 A 11.082024 $866,667 112.19 A 12.0S2026 $1,733,333 13.0S2028 $2,600,000 100.09 BB 10.082033 $2,287,212 102.69 BB Erie 107.78 BB 11.0S2024 $866,667 94.68 BB 12.0S2026 $1,733,333 13.0S2028 $2,600,000 100.18 BB 10.082033 $2,361,878 102.94 BB Ferris 108.17 BB 11.082024 $866,667 95.25 BB 12.082026 $1,733,333 13.082028 $2,600,000 10.082033 $420,545 BB BB Chester 11.0% 11.7% 12.1% 10.6% 100.09 102.69 107.78 94.68 BB BB 11.0S2024 $866,667 12.082026 $1,733,333 13.0S2028 $2,600,000 10.082033 $2,361,878 11.0% 11.7% 12.0% 10.5% 11.0% 11.7% 12.1% 10.7% 99.91 102.20 107.00 93.55 B B B B Next Year's Prime Rate 7.00% FOUNDATION FAST TRACK Page 2 Fast Track Round: 1 F135998_003 Dec. 31, 2023 Andrews Baldwin Chester Digby Erie Ferris $2,516 $2,295 $3,371 $1,593 $3,296 Financial Summary Cash Flow Statement Survey CashFlows from operating activities Net Income(Loss) Adjustment for non-cash items: Depreciation Extraordinary gains/losses/writeoffs Changes in current assets and liablilities Accounts payable Inventory Accounts Receivable Net cash from operations (5103) $960 $22 $1,064 $0 $1,426 $0 $1,020 $0 $1,426 $0 $1,133 $0 $126 $2,352 ($278) $3,079 $187 $1,027 ($687) $4,107 ($657) ($304) (558) $2,702 $222 $242 ($795) $4,060 ($836) ($597) $68 $1,654 ($161) ($626) ($274) $3,368 SO ($6,925) ($6,995) ($6,500) ($6,995) ($2,600) Cash flows from investing activities Plant improvements(net) Cash flows from financing activities Dividends paid Sales of common stock Purchase of common stock Cash from long term debt issued Early retirement of long term debt Retirement of current debt Cash from current debt borrowing Cash from emergency loan Net cash from financing activities Net change in cash position Balance Sheet Survey Cash Accounts Receivable Inventory Total Current Assets SO SO SO SO ($1.000) SO SO SO $0 $850 $0 $2,480 $0 $0 $3,691 $0 $0 $570 $0 $2.362 $0 $0 $3,679 $0 $0 $410 $0 $2,287 $0 $0 $3,679 $0 $0 $570 $0 $2,362 $0 $0 $3,679 $0 ($3,195) SO $0 $421 $0 So $3,679 SO ($1,000) $7,021 $6.610 $6,376 $6.610 $905 $2,079 Andrews $7,681 $3,632 SO $11,313 $4,203 Baldwin $9,805 $4,040 $1,325 $15,169 $2,317 Chester $7,919 $3,412 $2.656 $13,987 $3,936 Digby $9,537 $4,149 $2,110 $15,796 $1,270 Erio $6,871 $3,285 $2.949 $13,106 $1,673 Ferris $7,274 $3,628 $2,978 $13,880 Plant and equipment Accumulated Depreciation Total Fixed Assets Total Assets $14,400 ($5,760) $8,640 $19,953 $21,325 ($5,864) $15,461 $21,395 ($6,226) $15,168 $20,900 ($5,820) $15,080 $21,395 ($6,226) $15,168 $17,000 ($5,933) $11,067 $30,631 $29,155 $30,876 $28,274 $24.947 Accounts Payable Current Debt Total Current Liabilities Long Term Debt Total Liabilities $2.980 SO $2,980 $3,040 $3,691 $6,731 $2.196 $3.679 $5,875 $3,076 $3,679 $6.755 $2,017 $3,679 $5,696 $2,693 $3,679 $6,372 $4,222 $7,202 $7,680 $14,411 $7.562 $13,437 $7,487 $14,242 $7,562 $13,258 $5,621 $11.992 $2,323 $10,428 $12,751 $3,173 $13,046 $16,219 $2,893 $12,826 $15,719 $2.733 $13,902 $16,634 $2,893 $12,123 $15,016 $2,323 $10,631 $12.955 $19,953 $30,631 $29,155 $30,876 $28,274 $24,947 Common Stock Retained Earnings Total Equity Total Liabilities & Owners Equity Income Statement Survey Sales Variable Costs(Labor, Material, Carry) Contribution Margin Depreciation SGA(R&D Promo, Sales, Admin) Other (Fees Writeoffs,TQM, Bonuses) EBIT Interest(Short term, Long term) Taxes Profit Sharing Net Profit FOUNDATION FAST TRACK Andrews $44,188 $38,606 $5,582 $960 $4,211 $37 $374 $533 ($55) SO (S103) Baldwin $49,153 $38,173 $10,980 $1,064 $4,593 $166 $5,156 $1,207 $1,382 $51 $2,516 Chester $41,510 $32,076 $9.434 $1,426 $3,064 $147 $4,797 $1,194 $1,261 $47 $2,295 Digby $50,475 $37,917 $12,558 $1,020 $4,924 $135 $6,478 $1,186 $1,852 $69 $3,371 Erie $39,971 $31,774 $8,197 $1,426 $2,931 $147 $3,694 $1,194 $875 $33 $1,593 Ferris $44,137 $32,493 $11,644 $1,133 $4,316 $21 $6,173 $1,000 $1,811 $67 $3,296 Page 3 Production Analysis Fast Track Round: 1 F135998_003 Dec. 31, 2023 Production Vs. Capacity F135998_003 Andrews Baldwin Chester Digby Erie Ferris 0 100 200 300 900 1,000 1,100 1,200 1,300 1,400 400 500 600 o Capacity 700 800 Production 2nd Shift & Over- Age Unit Inven tory 0 Primary Segment Low Units Sold 1,473 Name Able Revision Date Dec 31 MTBF 4/1/2024 4.1 21000 Pfmn Size Coord_Coord Price 6.4 13.6 $29.99 Material Labor Cost Cost $14.73 $10.79 Auto mation Next Round 3.0 Contr. Marg. 13% Capacity Next Round 800 Plant Utiliz. 173% 75% Low Baker Bold 1,472 0 51 3/12/2023 05/12/2024 2.5 19800 0.0 0 6.4 0.0 13.8 $33.40 0.0 $0.00 $14.16 $10.88 $0.00 $0.00 22% 0% 81% 0% 3.2 3.0 849 298 179% 0% Cake Low 1,273 106 7/23/2023 2.3 18250 5.7 14.2 $32.60 $12.50 $10.56 23% 63% 4.8 849 162% Daze Dabble Low 1,442 0 81 3/16/2023 0 5/8/2024 2.4 20600 0.0 0 6.1 0.0 13.4 $35.00 0.0 $0.00 $14.52 $10.88 $0.00 $0.00 25% 0% 81% 0% 3.0 2.5 850 179% 0% 350 Eat Low 1,263 119 7/28/2023 2.3 17500 6.0 14.4 $31.65 $12.40 $10.54 21% 63% 4.B 849 162% Fast Low 1.213 112 10/21/2023 2.1 21500 7.6 12.7 $36.40 $17.15 $10.50 26% 56% 3.5 850 155% 1. Price 41% 29% 21% Low Tech Segment Analysis Fast Track Round: 1 F135998_003 Dec. 31, 2023 Low Tech Statistics Accessibility F135998_003 Low Tech Total Industry Unit Demand 5,544 Actual Industry Unit Sales 15,544 Andrews Segment % of Total Industry 168.1% Baldwin Next Year's Segment Growth Rate 10.0% Chester Low Tech Customer Buying Criteria Digby Expectations Importance Erie $15.00 - 35.00 2. Age Ideal Age = 3.0 Ferris 3. Reliability MTBF 14000-20000 4. Ideal Position Pfmn 5.3 Size 14.7 9% 20% 60% 80% 100 Perceptual Map for Low Tech Actual vs Potential Market Share Perceptual map (at end of this year) 20 2023 F135998_003 Low Tech 18 22% 20% 16 18% 16% 14 14% 12 12% 10% 10 8% 6% 4% 2 0% Size 00 8 N 2 Andrews 0 2 Potential 6 8 10 12 14 16 18 20 Actual Performance Top Products in Low Tech Segment Units Stock Out YES Size Coord 13.6 13.8 Name Able Baker Daze Cake Eat Fast Market Share 19% 18% 17% 17% 16% 13% Sold to Seg 1,068 985 933 925 914 719 Revision Date 4/1/2024 3/12/2023 3/16/2023 7/23/2023 7/28/2023 10/21/2023 Pfmn Coord 6.4 6.4 6.1 5.7 6.0 7.6 Cust. List Age Promo Aware- Price MTBF Dec.31 Budget ness $29.99 21000 4.10 $1,500 73% $33.40 19800 2.45 $1,300 67% $35.00 20600 2.45 $1,450 72% $32.60 18250 2.27 $925 56% $31.65 17500 2.26 $875 54% $36.40 21500 2.14 $1,500 73% Cust. Sales Access- Budgetibility $1,000 35% $1,300 39% $1,450 41% $925 34% $850 33% $1,275 36% Dec Cust Survey 21 20 19 17 16 8 13.4 14.2 14.4 12.7 Round: 1 Dec. 31, 2023 High Tech Segment Analysis Fast Track F135998_003 High Tech Statistics Accessibility F135998_003 High Tech Total Industry Unit Demand 2,592 Actual Industry Unit Sales Andrews 12,592 Segment % of Total Industry |31.9% Baldwin Next Year's Segment Growth Rate 120.0% Chester High Tech Customer Buying Criteria Digby Expectations Importance Erie 1. Ideal Position Pfmn 8.1 Size 11.9 33% 2. Age Ideal Age = 0.0 Ferris $25.00 - 45.00 4. Reliability MTBF 17000-23000 Perceptual Map for High Tech Actual vs Potential Market Share Perceptual map (at end of this year) 20 2023 F135998_003 High Tech 3. Price 29% 25% 13% 80% 100% 20% 18 16 14 18% 16% 14% 12% 10% 8% 6% 12 Dhalil Size 10 00 29 8 4 2 0% N Andrews 0 0 2 # Name Daze Fast Baker Able Eat Cake Market Share 20% 19% 19% 16% 13% 13% 6 8 10 12 14 16 18 20 Actual Potential Performance Top Products in High Tech Segment Units Cust. Cust. Sold to Revision Stock Pfmn Size List Age Promo Aware- Sales Access- Seg Date Out Coord Coord Price MTBF Dec.31 Budget ness Budgetibility 509 3/16/2023 6.1 13.4 $35.00 20600 2.45 $1.450 72% $1,450 42% 493 10/21/2023 7.6 12.7 $36.40 21500 2.14 $1,500 73% $1,275 39% 487 3/12/2023 6.4 13.8 $33.40 19800 2.45 $1,300 67% $1,300 40% 405 4/1/2024 YES 6.4 13.6 $29.99 21000 4.10 $1,500 73% $1,000 35% 349 7/28/2023 6.0 14.4 $31.65 17500 2.26 $875 54% $850 33% 348 7/23/2023 5.7 14.2 $32.60 18250 2.27 $925 56% $925 34% Dec. Cust Survey 12 24 12 12 ww288 Market Share Fast Track Round: 1 F135998_003 Dec. 31, 2023 Market Share F135998_003 20% 15% 10% 5% 0% Units Sold vs Demand Chart F135998_003 5,000 4.000 3.000 2.000 1.000 0 Low High Industry Unit Sales Total Unit Demand Actual Market Share in Units Low High Industry Unit Sales 5,544 2.592 % of Market 68.1% 31.9% Total 8,138 100.0% Able Total 19.3% 19.3% 15.6% 15.6% Low High Potential Market Share in Units Total Low High 8,136 Units Demanded 5,544 2,592 100.0% % of Market 68.1% 31.9% 18.1% Able 21.9% 17.8% 18.1% Total 21.9% 17.8% 18.1% Baker 17.2% 18.3% 18.1% Total 17.2% 18.3% 15.7% Cake 16.1% 13.1% 15.7% Total 16.1% 13.1% 20.6% 20.6% Baker Total 17.8% 17.8% 18.8% 18.8% 17.5% 17.5% Cake Total 16.7% 16.7% 13.4% 13.4% 15.2% 15.2% Daze Total 16.8% 16.8% 19.7% 19.7% 17.7% Daze 17.7% Total 16.3% 16.3% 19.1% 19.1% 17.2% 17.2% Eat Total 16.5% 16.5% 13.5% 13.5% 15.5% Eat 15.5% Total 16.0% 16.0% 13.1% 13.1% 15.1% 15.1% Fast Total 13.0% 13.0% 19.0% 19.0% 14.9% Fast 14.9% Total 12.6% 12.6% 18.5% 18.6% 14.5% 14.5% Foundation Perceptual Map Round: 1 Fast Track F135998_003 Dec 31, 2023 Perceptual Map for All Segments Perceptual map (at end of this year) 20 18 16 14 cfiat Daze Fast 12 Size 10 8 6 N 0 0 2 4 6 16 18 20 8 10 12 14 Performance Baldwin Pfmn Size Revised 6.4 13.8 3/12/2023 Andrews Chester Pfmn Name Able Size 13.6 Revised Name 4/1/2024 Baker Name Cake Pfmn 5.7 Size 14.2 Revised 7/23/2023 6.4 Digby Erie Ferris Pfmn Name Name Daze Pfmn 6.1 Size 13.4 Revised Name 3/16/2023 Eat Size 14.4 Revised 7/28/2023 Pfmn 7.6 Fast Size 12.7 Revised 10/21/2023 6.0 Foundation HR/TQM Report Fast Track Round: 1 F135998_003 Dec 31, 2023 Ferris Erie 250 250 154 96 240 240 154 86 Needed Complement Complement 1st Shift Complement 2nd Shift Complement Overtime Percent Turnover Rate New Employees Separated Employees Recruiting Spend Training Hours Productivity Index Recruiting Cost Separation Cost Training Cost Total HR Admin Cost Strike Days HUMAN RESOURCES SUMMARY Andrews Baldwin Chester 269 279 250 269 279 250 154 154 154 115 125 96 0.1% 0.0% 0.0% 10.0% 10.0% 10.0% 48 59 27 0 0 0 $0 SO $0 0 0 0 100.0% 100.0% 100.0% $48 $59 $27 $0 $0 $0 $0 $0 $0 $59 Digby 279 279 154 125 0.0% 10.0% 59 0 $0 0 100.0% $59 $0 $0 0.0% 10.0% 27 0 SO 0 100.0% $27 SO $0 $27 0.2% 10.0% 24 8 SO 0 100.0% $24 $40 SO $64 $48 $27 $59 TQM SUMMARY Andrews Baldwin Chester Digby Erie Ferris $ 888888 SO SO SO SO $O SO $0 $0 $0 $0 $0 $0 888888 $0 SO SO SO $0 SO $0 SO SO SO SO SO Process Mgt Budgets Last Year CPI Systems VendorJIT Quality Initiative Training Channel Support Systems Concurrent Engineering UNEP Green Programs TQM Budgets Last Year Benchmarking Quality Function Deployment Effort CCE/6 Sigma Training GEMI TQEM Sustainability Initiatives Total Expenditures Cumulative impacts Material Cost Reduction Labor Cost Reduction Reduction R&D Cycle Time Reduction Admin Costs Demand Increase 88888 SO SO $0 SO $0 $0 $0 $0 $0 $0 SO SO SO SO SO $0 SO SO SO SO $0 $0 0.00% 0.00% 0.00% 0.00% 0.00% 0.00% 0.00% 0.00% 0.00% 0.00% 0.00% 0.00% 0.00% 0.00% 0.00% 0.00% 0.00% 0.00% 0.00% 0.00% 0.00% 0.00% 0.00% 0.00% 0.00% 0.00% 0.00% 0.00% 0.00% 0.00% foundation Ethics Report Fast Track Round: 1 F135998_003 Dec. 31, 2023 ETHICS SUMMARY Other (Fees, Writeoffs, etc.) Demand Factor Material Cost Impact Admin Cost Impact Productivity Impact Awareness Impact Accessibility Impact The actual dollar impact. Example, $120 means Other increased by $120. The % of normal. 98% means demand fell 2%. The % of normal. 104% means matieral costs rose 4%. The % of normal. 103% means admin costs rose 3%. The % of normal. 104% means productivity increased by 4%. The % of normal. 105% means normal awareness was multiplied by 1.05. The % of normal. 98% means normal accessiblity was multiplied by 0.98. Normal means the value that would have been produced if the problem had not been presented. No Impact Andrews Baldwin Chester Digby Erie Ferris Total Other (Fees, Writeoffs, etc.) Demand Factor Material Cost Impact Admin Cost Impact Productivity Impact Awareness Impact Accessibility Impact $0 100% 100% 100% 100% 100% 100% so 100% 100% 100% 100% 100% 100% $0 100% 100% 100% 100% 100% 100% SO 100% 100% 100% 100% 100% 100% $0 100% 100% 100% 100% 100% 100% $0 100% 100% 100% 100% 100% 100% $0 100% 100% 100% 100% 100% 100% Annual Report Round: 1 Dec. 31, 2023 2022 Annual Report Andrews F135998_003 Balance Sheet DEANTIONS: Common Size: The common size column simply represents each item as a percentage of total ASSETS assets for that year. Cash Your end-of-year cash position. Accounts Receivable: Reflects the lag between delivery and payment of your products. Inventories: The Cash $7,681 current value of your inventory across al products. A zero $3,632 Account Receivable indicates your company stocked out. Urmet demand would, of course, fal to your competitors. Plant & Inventory SO Equipment The current value of your plant. Accum Total Current Assets $11,313 Deprec: The total accumulated depreciation from your plant. Acts Payable: What the company currently owes $14,400 Plant & Equipment suppliers for materials and services. Current Debt The debt the company is obligated to pay during the next year Accumulated Depreciation ($5,760) of operations. It includes emergency loans used to keep Total Fixed Assets $8,640 your company solvent should you run out of cash during $19,953 Total Assets the year. Long Term Debt The companys long term debt is in the form of bonds, and this represents the total value LIABILITIES & OWNERS of your bonds. Common Stock: The amount of capital EQUITY invested by shareholders in the company. Retained Earnings: The profits that the company chose to keep Accounts Payable $2,980 instead of paying to shareholders as dividends. Current Debt $0 Long Term Debt $4,222 Total Liabilities $7,202 2023 Common Size 38.5% 18.2% 0.0% 56.7% $5,602 $3,353 $2,352 $11,307 72.2% -28.9% 43.3% 100.0% $14,400 (4,800) $9,600 $20,907 14.9% 0.0% 21.2% 36.1% $2,853 SO $5,200 $8,053 $2,323 $10,428 Common Stock Retained Earnings Total Equity Total Liab. & O. Equity 11.6% 52.3% 63.9% 100.0% $2,323 $10,531 $12,854 $20.907 $12.751 $19,953 Cash Flow Statement The Cash Flow Statement examines what happened in the Cash Account during the year. Cash injections appear as positive numbers and cash withdrawals as negative numbers. The Cash Flow Statement is an excelent tool for diagnosing emergency loans. When negative cash flows exceed positives, you are forced to seek emergency funding. For example, ir sales are bad and you find yourself canying an abundance of excess inventory, the report would show the increase in inventory as a huge negative cash flow. Too much unexpected inventory could outstrip your inflows, exhaust your starting cash and force you to beg for money to keep your company afloat. 2023 ($103) $960 $22 $126 $2,352 ($278) $3,079 2022 $2,494 $960 $0 $853 ($2,352) $3,647 $5,602 $0 $0 Cash Flows from Operating Activities Net Income(Loss) Depreciation Extraordinary gains/losses/writeoffs Accounts Payable Inventory Accounts Receivable Net cash from operation Cash Flows from Investing Activities Plant Improvements Cash Flows from Financing Activities Dividends paid Sales of common stock Purchase of common stock Cash from long term debt Retirement of long term debt Change in current debt(net) Net cash from financing activities Net change in cash position Closing cash position Cash Flow Summary Andrews F135998_003 3.000 2.000 $0 $0 $0 $0 ($1,000) $0 ($1,000) $2,079 $7,681 ($1,000) SO SO SO SO SO ($1,000) $4,602 $5,602 1.000 0 -1.000 Operations Operations O Che Cash Finance Che Cash Investment Finance SO 50 88888 Annual Report Andrews F135998_003 Round: 1 Dec. 31, 2023 2023 Income Statement (Product Name) Able 2023 Common Total Size Sales $44,188 $0 $0 so $0 $0 $44,188 100.0% Variable Costs: Direct Labor $15,835 $0 $0 $0 SO SO $0 $ $15,835 35.8% Direct Material $22.771 $0 $0 SO SO SO $0 $ 51.5% Inventory Carry $22,771 $0 $0 $0 SO SO SO $0 $0 0.0% Total Variable $38.606 $O $O SO SO SO $0 $38,606 87.4% Contribution Margin $5,582 $0 $0 SO SO SO $0 $ $5,582 12.6% Period Costs: Depreciation $960 $0 $0 SO SO SO $0 $960 2.2% SG&A: R&D $1,000 $0 $0 SO $0 SO $0 $1,000 2.3% Promotions $1,500 $0 $0 SO SO SO $0 $1,500 3.4% Sales $1,000 $0 $0 SO $0 SO $0 $1,000 2.3% Admin $711 $0 $0 SO $0 $0 $0 $ $711 Total Period $5,171 $0 SO SO SO SO $0 $ $5.171 11.7% Net Margin $411 $0 $0 SO $0 SO $0 $ $411 0.9% Definitions: Sales: Unt Sales times ist price. Direct Labor: Labor costs incurred to produce the product Other $37 0.1% that was sold. Inventory Carry Cost: the cost unsold goods in inventory. Depreciation: Calculated on EBIT $374 0.8% straight-ne. 15-year depreciation of plant value. R&D Costs: R&D department expenditures for each Short Term Interest $0 0.0% product. Admin Administration overhead is estimated at 1.5% of sales. Promotions: The promotion budget Long Term Interest $533 1.2% for each product. Sales: The sales force budget for each product. Other: Chargs not included in other Taxes ($55) -0.1% Categories such as Fees, Wite offs, and TOM. The fees include money paid to investment bankers and Profit Sharing $0 0.0% brokerage firms to issue new stocks or bonds plus consulting fees your instructor might assess. Wite-offs Net Profit ($103) -0.2% include the loss you might experience when you sel capacity or liquidate inventory as the result of elminating a production line. If the amount appears as a negative amount, then you actualy made money Variable Margins on the iquidation of capacity or inventory. EBIT: Eamings Before Interest and Taxes. Short Term Interest 2023 Andrews F135998_003 Interest expense based on last years current debt, including short term debt, long term notes that have become due, and emergency bans, Long Term Interest Interest paid on outstanding bonds. Taxes: Income tax based upon a 35% tax rate. Profit Sharing: Profts shared with employees under the labor 10 contract. Net Profit EBIT minus interest, taxes, and profit sharing 1.6% Market Share History F135998_003 Profit History F135998_003 $2.000 $1,000 SO 2022 10% 0% 2023 2022 2023 ROE History F135998_003 20% 10% 0% 2022 Asset Turnover History F135998_003 2.0 1.0 0.0 2022 2023 2023 ROS History F135998_003 5% ROA History F135998_003 10% 5% 0% 0% 2022 2023 2022 2023 Annual Report Page 12 Foundation Round: 1 Dec. 31, 2023 Andrews Jon Scott FastTrack F135998_003 Baldwin Chester Digby Erie Ferris Selected Financial Statistics Andrews ROS -0.2% Asset Turnover 2.21 ROA -0.5% Leverage 1.6 ROE -0.8% Emergency Loan SO Sales $44,188,295 EBIT $374,368 Profits ($102,884) Cumulative Profit $2,390,821 SG&A / Sales 9.5% Contrib. Margin% 12.6% Percent of Sales F135998_003 Baldwin 5.1% 1.60 8.2% 1.9 15.5% $0 $49,153,282 $5,156,361 $2,515,876 $5,009,582 9.3% 22.3% Chester 5.5% 1.42 7.9% 1.9 14.6% $0 $41,509,949 $4,797,472 $2,295,476 $4,789,181 7.4% 22.7% Digby 6.7% 1.64 10.9% 1.9 20.3% $0 $50,474,958 $6,478,490 $3,371,041 $5,864,746 9.8% 24.9% Erie 4.0% 1.41 5.6% 1.9 10.6% $0 $39,971,052 $3,693,924 $1,592,516 $4,086,221 7.3% 20.5% Ferris 7.5% 1.77 13.2% 1.9 25.4% $0 $44, 136,678 $6,173,292 $3,295,536 $5,789,242 9.8% 26.4% S Market Share F135998_003 100% Var Cost Depr O SGA Other Profit 90% 80% 70% 60% 50% 40% 30% 20% 10% Andrews 16.4% Baldwin 18.24% Chester 15.41 % Digby 18.73% Erie 14.84 % Ferris 16.38% Andrews Chester Digby Erie Ferris Close EPS Dividend Yield PIE Company Andrews Baldwin Chester Digby Erie Ferris $9.21 $14.44 $14.02 $16.13 $12.64 $16.01 Stock Market Summary Book Value MarketCap Change Shares ($M) Per Share ($1.95) 2,000,000 $18 $6.38 $3.27 2,076,077 $30 $7.81 $2.85 2,051,004 $29 $7.66 $4.96 2,036,677 $33 $8.17 $1.48 2,051,004 $26 $7.32 $4.84 2,000,000 $32 $6.48 Closing Stock Price F135998_003 ($0.05) $1.21 $1.12 $1.66 $0.78 $1.65 $0.00 $0.00 $0.00 $0.00 $0.00 $1.60 0.0% 0.0% 0.0% 0.0% 0.0% 10.0% -182.7 11.9 12.5 9.7 16.3 9.7 $35 $30 $25 Andrews Baldwin Chester Digby Erie Ferris $20 $15 $10 S5 SO 2022 2023 2024 2025 2026 2027 2028 2029 2030 Series# Face Yield Yield Closes S&P Company Andrews 12.0S2026 $1,622,094 13.0S2028 $2,600,000 11.4% 11.6% Baldwin 11.0% 11.7% 12.0% 10.5% 100.18 102.94 108.17 95.25 BB BB BB BB 11.082024 $866,667 12.082026 $1,733,333 13.0S2028 $2,600,000 10.082033 $2,480,000 11.0% 11.7% 12.1% 10.6% Bond Market Summary Close$ S&P Company Series# Face Digby 105.49 A 11.082024 $866,667 112.19 A 12.0S2026 $1,733,333 13.0S2028 $2,600,000 100.09 BB 10.082033 $2,287,212 102.69 BB Erie 107.78 BB 11.0S2024 $866,667 94.68 BB 12.0S2026 $1,733,333 13.0S2028 $2,600,000 100.18 BB 10.082033 $2,361,878 102.94 BB Ferris 108.17 BB 11.082024 $866,667 95.25 BB 12.082026 $1,733,333 13.082028 $2,600,000 10.082033 $420,545 BB BB Chester 11.0% 11.7% 12.1% 10.6% 100.09 102.69 107.78 94.68 BB BB 11.0S2024 $866,667 12.082026 $1,733,333 13.0S2028 $2,600,000 10.082033 $2,361,878 11.0% 11.7% 12.0% 10.5% 11.0% 11.7% 12.1% 10.7% 99.91 102.20 107.00 93.55 B B B B Next Year's Prime Rate 7.00% FOUNDATION FAST TRACK Page 2 Fast Track Round: 1 F135998_003 Dec. 31, 2023 Andrews Baldwin Chester Digby Erie Ferris $2,516 $2,295 $3,371 $1,593 $3,296 Financial Summary Cash Flow Statement Survey CashFlows from operating activities Net Income(Loss) Adjustment for non-cash items: Depreciation Extraordinary gains/losses/writeoffs Changes in current assets and liablilities Accounts payable Inventory Accounts Receivable Net cash from operations (5103) $960 $22 $1,064 $0 $1,426 $0 $1,020 $0 $1,426 $0 $1,133 $0 $126 $2,352 ($278) $3,079 $187 $1,027 ($687) $4,107 ($657) ($304) (558) $2,702 $222 $242 ($795) $4,060 ($836) ($597) $68 $1,654 ($161) ($626) ($274) $3,368 SO ($6,925) ($6,995) ($6,500) ($6,995) ($2,600) Cash flows from investing activities Plant improvements(net) Cash flows from financing activities Dividends paid Sales of common stock Purchase of common stock Cash from long term debt issued Early retirement of long term debt Retirement of current debt Cash from current debt borrowing Cash from emergency loan Net cash from financing activities Net change in cash position Balance Sheet Survey Cash Accounts Receivable Inventory Total Current Assets SO SO SO SO ($1.000) SO SO SO $0 $850 $0 $2,480 $0 $0 $3,691 $0 $0 $570 $0 $2.362 $0 $0 $3,679 $0 $0 $410 $0 $2,287 $0 $0 $3,679 $0 $0 $570 $0 $2,362 $0 $0 $3,679 $0 ($3,195) SO $0 $421 $0 So $3,679 SO ($1,000) $7,021 $6.610 $6,376 $6.610 $905 $2,079 Andrews $7,681 $3,632 SO $11,313 $4,203 Baldwin $9,805 $4,040 $1,325 $15,169 $2,317 Chester $7,919 $3,412 $2.656 $13,987 $3,936 Digby $9,537 $4,149 $2,110 $15,796 $1,270 Erio $6,871 $3,285 $2.949 $13,106 $1,673 Ferris $7,274 $3,628 $2,978 $13,880 Plant and equipment Accumulated Depreciation Total Fixed Assets Total Assets $14,400 ($5,760) $8,640 $19,953 $21,325 ($5,864) $15,461 $21,395 ($6,226) $15,168 $20,900 ($5,820) $15,080 $21,395 ($6,226) $15,168 $17,000 ($5,933) $11,067 $30,631 $29,155 $30,876 $28,274 $24.947 Accounts Payable Current Debt Total Current Liabilities Long Term Debt Total Liabilities $2.980 SO $2,980 $3,040 $3,691 $6,731 $2.196 $3.679 $5,875 $3,076 $3,679 $6.755 $2,017 $3,679 $5,696 $2,693 $3,679 $6,372 $4,222 $7,202 $7,680 $14,411 $7.562 $13,437 $7,487 $14,242 $7,562 $13,258 $5,621 $11.992 $2,323 $10,428 $12,751 $3,173 $13,046 $16,219 $2,893 $12,826 $15,719 $2.733 $13,902 $16,634 $2,893 $12,123 $15,016 $2,323 $10,631 $12.955 $19,953 $30,631 $29,155 $30,876 $28,274 $24,947 Common Stock Retained Earnings Total Equity Total Liabilities & Owners Equity Income Statement Survey Sales Variable Costs(Labor, Material, Carry) Contribution Margin Depreciation SGA(R&D Promo, Sales, Admin) Other (Fees Writeoffs,TQM, Bonuses) EBIT Interest(Short term, Long term) Taxes Profit Sharing Net Profit FOUNDATION FAST TRACK Andrews $44,188 $38,606 $5,582 $960 $4,211 $37 $374 $533 ($55) SO (S103) Baldwin $49,153 $38,173 $10,980 $1,064 $4,593 $166 $5,156 $1,207 $1,382 $51 $2,516 Chester $41,510 $32,076 $9.434 $1,426 $3,064 $147 $4,797 $1,194 $1,261 $47 $2,295 Digby $50,475 $37,917 $12,558 $1,020 $4,924 $135 $6,478 $1,186 $1,852 $69 $3,371 Erie $39,971 $31,774 $8,197 $1,426 $2,931 $147 $3,694 $1,194 $875 $33 $1,593 Ferris $44,137 $32,493 $11,644 $1,133 $4,316 $21 $6,173 $1,000 $1,811 $67 $3,296 Page 3 Production Analysis Fast Track Round: 1 F135998_003 Dec. 31, 2023 Production Vs. Capacity F135998_003 Andrews Baldwin Chester Digby Erie Ferris 0 100 200 300 900 1,000 1,100 1,200 1,300 1,400 400 500 600 o Capacity 700 800 Production 2nd Shift & Over- Age Unit Inven tory 0 Primary Segment Low Units Sold 1,473 Name Able Revision Date Dec 31 MTBF 4/1/2024 4.1 21000 Pfmn Size Coord_Coord Price 6.4 13.6 $29.99 Material Labor Cost Cost $14.73 $10.79 Auto mation Next Round 3.0 Contr. Marg. 13% Capacity Next Round 800 Plant Utiliz. 173% 75% Low Baker Bold 1,472 0 51 3/12/2023 05/12/2024 2.5 19800 0.0 0 6.4 0.0 13.8 $33.40 0.0 $0.00 $14.16 $10.88 $0.00 $0.00 22% 0% 81% 0% 3.2 3.0 849 298 179% 0% Cake Low 1,273 106 7/23/2023 2.3 18250 5.7 14.2 $32.60 $12.50 $10.56 23% 63% 4.8 849 162% Daze Dabble Low 1,442 0 81 3/16/2023 0 5/8/2024 2.4 20600 0.0 0 6.1 0.0 13.4 $35.00 0.0 $0.00 $14.52 $10.88 $0.00 $0.00 25% 0% 81% 0% 3.0 2.5 850 179% 0% 350 Eat Low 1,263 119 7/28/2023 2.3 17500 6.0 14.4 $31.65 $12.40 $10.54 21% 63% 4.B 849 162% Fast Low 1.213 112 10/21/2023 2.1 21500 7.6 12.7 $36.40 $17.15 $10.50 26% 56% 3.5 850 155% 1. Price 41% 29% 21% Low Tech Segment Analysis Fast Track Round: 1 F135998_003 Dec. 31, 2023 Low Tech Statistics Accessibility F135998_003 Low Tech Total Industry Unit Demand 5,544 Actual Industry Unit Sales 15,544 Andrews Segment % of Total Industry 168.1% Baldwin Next Year's Segment Growth Rate 10.0% Chester Low Tech Customer Buying Criteria Digby Expectations Importance Erie $15.00 - 35.00 2. Age Ideal Age = 3.0 Ferris 3. Reliability MTBF 14000-20000 4. Ideal Position Pfmn 5.3 Size 14.7 9% 20% 60% 80% 100 Perceptual Map for Low Tech Actual vs Potential Market Share Perceptual map (at end of this year) 20 2023 F135998_003 Low Tech 18 22% 20% 16 18% 16% 14 14% 12 12% 10% 10 8% 6% 4% 2 0% Size 00 8 N 2 Andrews 0 2 Potential 6 8 10 12 14 16 18 20 Actual Performance Top Products in Low Tech Segment Units Stock Out YES Size Coord 13.6 13.8 Name Able Baker Daze Cake Eat Fast Market Share 19% 18% 17% 17% 16% 13% Sold to Seg 1,068 985 933 925 914 719 Revision Date 4/1/2024 3/12/2023 3/16/2023 7/23/2023 7/28/2023 10/21/2023 Pfmn Coord 6.4 6.4 6.1 5.7 6.0 7.6 Cust. List Age Promo Aware- Price MTBF Dec.31 Budget ness $29.99 21000 4.10 $1,500 73% $33.40 19800 2.45 $1,300 67% $35.00 20600 2.45 $1,450 72% $32.60 18250 2.27 $925 56% $31.65 17500 2.26 $875 54% $36.40 21500 2.14 $1,500 73% Cust. Sales Access- Budgetibility $1,000 35% $1,300 39% $1,450 41% $925 34% $850 33% $1,275 36% Dec Cust Survey 21 20 19 17 16 8 13.4 14.2 14.4 12.7 Round: 1 Dec. 31, 2023 High Tech Segment Analysis Fast Track F135998_003 High Tech Statistics Accessibility F135998_003 High Tech Total Industry Unit Demand 2,592 Actual Industry Unit Sales Andrews 12,592 Segment % of Total Industry |31.9% Baldwin Next Year's Segment Growth Rate 120.0% Chester High Tech Customer Buying Criteria Digby Expectations Importance Erie 1. Ideal Position Pfmn 8.1 Size 11.9 33% 2. Age Ideal Age = 0.0 Ferris $25.00 - 45.00 4. Reliability MTBF 17000-23000 Perceptual Map for High Tech Actual vs Potential Market Share Perceptual map (at end of this year) 20 2023 F135998_003 High Tech 3. Price 29% 25% 13% 80% 100% 20% 18 16 14 18% 16% 14% 12% 10% 8% 6% 12 Dhalil Size 10 00 29 8 4 2 0% N Andrews 0 0 2 # Name Daze Fast Baker Able Eat Cake Market Share 20% 19% 19% 16% 13% 13% 6 8 10 12 14 16 18 20 Actual Potential Performance Top Products in High Tech Segment Units Cust. Cust. Sold to Revision Stock Pfmn Size List Age Promo Aware- Sales Access- Seg Date Out Coord Coord Price MTBF Dec.31 Budget ness Budgetibility 509 3/16/2023 6.1 13.4 $35.00 20600 2.45 $1.450 72% $1,450 42% 493 10/21/2023 7.6 12.7 $36.40 21500 2.14 $1,500 73% $1,275 39% 487 3/12/2023 6.4 13.8 $33.40 19800 2.45 $1,300 67% $1,300 40% 405 4/1/2024 YES 6.4 13.6 $29.99 21000 4.10 $1,500 73% $1,000 35% 349 7/28/2023 6.0 14.4 $31.65 17500 2.26 $875 54% $850 33% 348 7/23/2023 5.7 14.2 $32.60 18250 2.27 $925 56% $925 34% Dec. Cust Survey 12 24 12 12 ww288 Market Share Fast Track Round: 1 F135998_003 Dec. 31, 2023 Market Share F135998_003 20% 15% 10% 5% 0% Units Sold vs Demand Chart F135998_003 5,000 4.000 3.000 2.000 1.000 0 Low High Industry Unit Sales Total Unit Demand Actual Market Share in Units Low High Industry Unit Sales 5,544 2.592 % of Market 68.1% 31.9% Total 8,138 100.0% Able Total 19.3% 19.3% 15.6% 15.6% Low High Potential Market Share in Units Total Low High 8,136 Units Demanded 5,544 2,592 100.0% % of Market 68.1% 31.9% 18.1% Able 21.9% 17.8% 18.1% Total 21.9% 17.8% 18.1% Baker 17.2% 18.3% 18.1% Total 17.2% 18.3% 15.7% Cake 16.1% 13.1% 15.7% Total 16.1% 13.1% 20.6% 20.6% Baker Total 17.8% 17.8% 18.8% 18.8% 17.5% 17.5% Cake Total 16.7% 16.7% 13.4% 13.4% 15.2% 15.2% Daze Total 16.8% 16.8% 19.7% 19.7% 17.7% Daze 17.7% Total 16.3% 16.3% 19.1% 19.1% 17.2% 17.2% Eat Total 16.5% 16.5% 13.5% 13.5% 15.5% Eat 15.5% Total 16.0% 16.0% 13.1% 13.1% 15.1% 15.1% Fast Total 13.0% 13.0% 19.0% 19.0% 14.9% Fast 14.9% Total 12.6% 12.6% 18.5% 18.6% 14.5% 14.5% Foundation Perceptual Map Round: 1 Fast Track F135998_003 Dec 31, 2023 Perceptual Map for All Segments Perceptual map (at end of this year) 20 18 16 14 cfiat Daze Fast 12 Size 10 8 6 N 0 0 2 4 6 16 18 20 8 10 12 14 Performance Baldwin Pfmn Size Revised 6.4 13.8 3/12/2023 Andrews Chester Pfmn Name Able Size 13.6 Revised Name 4/1/2024 Baker Name Cake Pfmn 5.7 Size 14.2 Revised 7/23/2023 6.4 Digby Erie Ferris Pfmn Name Name Daze Pfmn 6.1 Size 13.4 Revised Name 3/16/2023 Eat Size 14.4 Revised 7/28/2023 Pfmn 7.6 Fast Size 12.7 Revised 10/21/2023 6.0 Foundation HR/TQM Report Fast Track Round: 1 F135998_003 Dec 31, 2023 Ferris Erie 250 250 154 96 240 240 154 86 Needed Complement Complement 1st Shift Complement 2nd Shift Complement Overtime Percent Turnover Rate New Employees Separated Employees Recruiting Spend Training Hours Productivity Index Recruiting Cost Separation Cost Training Cost Total HR Admin Cost Strike Days HUMAN RESOURCES SUMMARY Andrews Baldwin Chester 269 279 250 269 279 250 154 154 154 115 125 96 0.1% 0.0% 0.0% 10.0% 10.0% 10.0% 48 59 27 0 0 0 $0 SO $0 0 0 0 100.0% 100.0% 100.0% $48 $59 $27 $0 $0 $0 $0 $0 $0 $59 Digby 279 279 154 125 0.0% 10.0% 59 0 $0 0 100.0% $59 $0 $0 0.0% 10.0% 27 0 SO 0 100.0% $27 SO $0 $27 0.2% 10.0% 24 8 SO 0 100.0% $24 $40 SO $64 $48 $27 $59 TQM SUMMARY Andrews Baldwin Chester Digby Erie Ferris $ 888888 SO SO SO SO $O SO $0 $0 $0 $0 $0 $0 888888 $0 SO SO SO $0 SO $0 SO SO SO SO SO Process Mgt Budgets Last Year CPI Systems VendorJIT Quality Initiative Training Channel Support Systems Concurrent Engineering UNEP Green Programs TQM Budgets Last Year Benchmarking Quality Function Deployment Effort CCE/6 Sigma Training GEMI TQEM Sustainability Initiatives Total Expenditures Cumulative impacts Material Cost Reduction Labor Cost Reduction Reduction R&D Cycle Time Reduction Admin Costs Demand Increase 88888 SO SO $0 SO $0 $0 $0 $0 $0 $0 SO SO SO SO SO $0 SO SO SO SO $0 $0 0.00% 0.00% 0.00% 0.00% 0.00% 0.00% 0.00% 0.00% 0.00% 0.00% 0.00% 0.00% 0.00% 0.00% 0.00% 0.00% 0.00% 0.00% 0.00% 0.00% 0.00% 0.00% 0.00% 0.00% 0.00% 0.00% 0.00% 0.00% 0.00% 0.00% foundation Ethics Report Fast Track Round: 1 F135998_003 Dec. 31, 2023 ETHICS SUMMARY Other (Fees, Writeoffs, etc.) Demand Factor Material Cost Impact Admin Cost Impact Productivity Impact Awareness Impact Accessibility Impact The actual dollar impact. Example, $120 means Other increased by $120. The % of normal. 98% means demand fell 2%. The % of normal. 104% means matieral costs rose 4%. The % of normal. 103% means admin costs rose 3%. The % of normal. 104% means productivity increased by 4%. The % of normal. 105% means normal awareness was multiplied by 1.05. The % of normal. 98% means normal accessiblity was multiplied by 0.98. Normal means the value that would have been produced if the problem had not been presented. No Impact Andrews Baldwin Chester Digby Erie Ferris Total Other (Fees, Writeoffs, etc.) Demand Factor Material Cost Impact Admin Cost Impact Productivity Impact Awareness Impact Accessibility Impact $0 100% 100% 100% 100% 100% 100% so 100% 100% 100% 100% 100% 100% $0 100% 100% 100% 100% 100% 100% SO 100% 100% 100% 100% 100% 100% $0 100% 100% 100% 100% 100% 100% $0 100% 100% 100% 100% 100% 100% $0 100% 100% 100% 100% 100% 100% Annual Report Round: 1 Dec. 31, 2023 2022 Annual Report Andrews F135998_003 Balance Sheet DEANTIONS: Common Size: The common size column simply represents each item as a percentage of total ASSETS assets for that year. Cash Your end-of-year cash position. Accounts Receivable: Reflects the lag between delivery and payment of your products. Inventories: The Cash $7,681 current value of your inventory across al products. A zero $3,632 Account Receivable indicates your company stocked out. Urmet demand would, of course, fal to your competitors. Plant & Inventory SO Equipment The current value of your plant. Accum Total Current Assets $11,313 Deprec: The total accumulated depreciation from your plant. Acts Payable: What the company currently owes $14,400 Plant & Equipment suppliers for materials and services. Current Debt The debt the company is obligated to pay during the next year Accumulated Depreciation ($5,760) of operations. It includes emergency loans used to keep Total Fixed Assets $8,640 your company solvent should you run out of cash during $19,953 Total Assets the year. Long Term Debt The companys long term debt is in the form of bonds, and this represents the total value LIABILITIES & OWNERS of your bonds. Common Stock: The amount of capital EQUITY invested by shareholders in the company. Retained Earnings: The profits that the company chose to keep Accounts Payable $2,980 instead of paying to shareholders as dividends. Current Debt $0 Long Term Debt $4,222 Total Liabilities $7,202 2023 Common Size 38.5% 18.2% 0.0% 56.7% $5,602 $3,353 $2,352 $11,307 72.2% -28.9% 43.3% 100.0% $14,400 (4,800) $9,600 $20,907 14.9% 0.0% 21.2% 36.1% $2,853 SO $5,200 $8,053 $2,323 $10,428 Common Stock Retained Earnings Total Equity Total Liab. & O. Equity 11.6% 52.3% 63.9% 100.0% $2,323 $10,531 $12,854 $20.907 $12.751 $19,953 Cash Flow Statement The Cash Flow Statement examines what happened in the Cash Account during the year. Cash injections appear as positive numbers and cash withdrawals as negative numbers. The Cash Flow Statement is an excelent tool for diagnosing emergency loans. When negative cash flows exceed positives, you are forced to seek emergency funding. For example, ir sales are bad and you find yourself canying an abundance of excess inventory, the report would show the increase in inventory as a huge negative cash flow. Too much unexpected inventory could outstrip your inflows, exhaust your starting cash and force you to beg for money to keep your company afloat. 2023 ($103) $960 $22 $126 $2,352 ($278) $3,079 2022 $2,494 $960 $0 $853 ($2,352) $3,647 $5,602 $0 $0 Cash Flows from Operating Activities Net Income(Loss) Depreciation Extraordinary gains/losses/writeoffs Accounts Payable Inventory Accounts Receivable Net cash from operation Cash Flows from Investing Activities Plant Improvements Cash Flows from Financing Activities Dividends paid Sales of common stock Purchase of common stock Cash from long term debt Retirement of long term debt Change in current debt(net) Net cash from financing activities Net change in cash position Closing cash position Cash Flow Summary Andrews F135998_003 3.000 2.000 $0 $0 $0 $0 ($1,000) $0 ($1,000) $2,079 $7,681 ($1,000) SO SO SO SO SO ($1,000) $4,602 $5,602 1.000 0 -1.000 Operations Operations O Che Cash Finance Che Cash Investment Finance SO 50 88888 Annual Report Andrews F135998_003 Round: 1 Dec. 31, 2023 2023 Income Statement (Product Name) Able 2023 Common Total Size Sales $44,188 $0 $0 so $0 $0 $44,188 100.0% Variable Costs: Direct Labor $15,835 $0 $0 $0 SO SO $0 $ $15,835 35.8% Direct Material $22.771 $0 $0 SO SO SO $0 $ 51.5% Inventory Carry $22,771 $0 $0 $0 SO SO SO $0 $0 0.0% Total Variable $38.606 $O $O SO SO SO $0 $38,606 87.4% Contribution Margin $5,582 $0 $0 SO SO SO $0 $ $5,582 12.6% Period Costs: Depreciation $960 $0 $0 SO SO SO $0 $960 2.2% SG&A: R&D $1,000 $0 $0 SO $0 SO $0 $1,000 2.3% Promotions $1,500 $0 $0 SO SO SO $0 $1,500 3.4% Sales $1,000 $0 $0 SO $0 SO $0 $1,000 2.3% Admin $711 $0 $0 SO $0 $0 $0 $ $711 Total Period $5,171 $0 SO SO SO SO $0 $ $5.171 11.7% Net Margin $411 $0 $0 SO $0 SO $0 $ $411 0.9% Definitions: Sales: Unt Sales times ist price. Direct Labor: Labor costs incurred to produce the product Other $37 0.1% that was sold. Inventory Carry Cost: the cost unsold goods in inventory. Depreciation: Calculated on EBIT $374 0.8% straight-ne. 15-year depreciation of plant value. R&D Costs: R&D department expenditures for each Short Term Interest $0 0.0% product. Admin Administration overhead is estimated at 1.5% of sales. Promotions: The promotion budget Long Term Interest $533 1.2% for each product. Sales: The sales force budget for each product. Other: Chargs not included in other Taxes ($55) -0.1% Categories such as Fees, Wite offs, and TOM. The fees include money paid to investment bankers and Profit Sharing $0 0.0% brokerage firms to issue new stocks or bonds plus consulting fees your instructor might assess. Wite-offs Net Profit ($103) -0.2% include the loss you might experience when you sel capacity or liquidate inventory as the result of elminating a production line. If the amount appears as a negative amount, then you actualy made money Variable Margins on the iquidation of capacity or inventory. EBIT: Eamings Before Interest and Taxes. Short Term Interest 2023 Andrews F135998_003 Interest expense based on last years current debt, including short term debt, long term notes that have become due, and emergency bans, Long Term Interest Interest paid on outstanding bonds. Taxes: Income tax based upon a 35% tax rate. Profit Sharing: Profts shared with employees under the labor 10 contract. Net Profit EBIT minus interest, taxes, and profit sharing 1.6% Market Share History F135998_003 Profit History F135998_003 $2.000 $1,000 SO 2022 10% 0% 2023 2022 2023 ROE History F135998_003 20% 10% 0% 2022 Asset Turnover History F135998_003 2.0 1.0 0.0 2022 2023 2023 ROS History F135998_003 5% ROA History F135998_003 10% 5% 0% 0% 2022 2023 2022 2023 Annual Report Page 12