Can someone help me with the formulas and entering the information in using the income statement and balance sheet? If more problems are required to find the answer, can you please show me how to find it? Thank you!


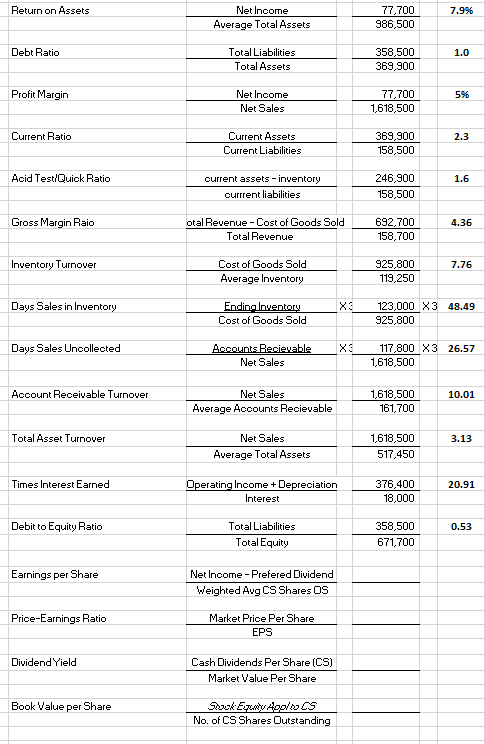
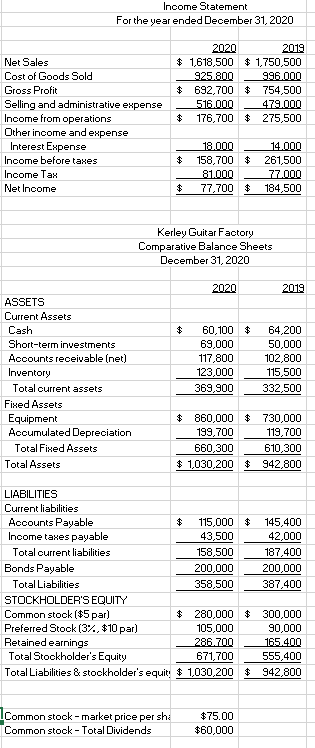
Return on Assets 7.996 Net Income Average Total Assets 77,700 986,500 Debt Ratio 1.0 Total Liabilities Total Assets 358,500 369,900 Profit Margin 596 Net Income Net Sales 77,700 1,618,500 Current Ratio 2.3 Current Assets Current Liabilities 369,900 158,500 Acid Test/Quick Ratio 1.6 current assets - inventory currrent liabilities 246,900 158,500 Gross Margin Raio 4.36 otal Revenue - Cost of Goods Sold Total Revenue 692,700 158,700 Inventory Turnover 7.76 Cost of Goods Sold Average Inventory 925,800 119,250 Days Sales in Inventory Ending Inventory Cost of Goods Sold 123,000 X3 48.49 925,800 Days Sales Unoollected X3 Accounts Recievable Net Sales 117,800 X3 26.57 1,618,500 Account Receivable Turnover 10.01 Net Sales Average Accounts Recievable 1,618,500 161,700 Total Asset Turnover 3.13 Net Sales Average Total Assets 1,618,500 517,450 Times Interest Earned 20.91 Operating Income + Depreciation Interest 376,400 18,000 Debit to Equity Ratio 0.53 Total Liabilities Total Equity 358,500 671,700 Earnings per Share Net Income - Prefered Dividend Weighted Avg CS Shares OS Price-Earnings Ratio Market Price Per Share EPS Dividend Yield Cash Dividends Per Share (CS) Market Value Per Share Book Value per Share Shek Evteals No. of CS Shares Outstanding Income Statement For the year ended December 31, 2020 2020 2019 $ 1,618,500 $1,750,500 925.800 996.000 $ 692,700 $ 754,500 516.000 479.000 $ 176,700 $ 275,500 Net Sales Cost of Goods Sold Gross Profit Selling and administrative expense Income from operations Other income and expense Interest Expense Income before taxes Income Tax Net Income $ 18.000 158,700 $ 81.000 77,700 $ 14.000 261,500 77.000 184,500 Kerley Guitar Factory Comparative Balance Sheets December 31, 2020 2020 2019 ASSETS Current Assets Cash Short-term investments Accounts receivable (net) Inventory Total current assets Fixed Assets Equipment Accumulated Depreciation Total Fixed Assets Total Assets 60,100 $ 69,000 117,800 123,000 369,900 64,200 50,000 102,800 115,500 332,500 $ 860,000 $ 730,000 199,700 119,700 660,300 610,300 $ 1,030,200 $ 942,800 LIABILITIES Current liabilities Accounts Payable $ 115,000 $ 145,400 Income taxes payable 43,500 42,000 Total current liabilities 158,500 187,400 Bonds Payable 200,000 200,000 Total Liabilities 358,500 387,400 STOCKHOLDER'S EQUITY Common stock ($5 par) $ 280,000 $ 300,000 Preferred Stook (3%, $10 par) 105,000 90,000 Retained earnings 286.700 165.400 Total Stookholder's Equity 671,700 555,400 Total Liabilities & stockholder's equit! $ 1,030,200 $ 942,800 Common stock - market price per sh Common stock - Total Dividends $75.00 $60,000


