Answered step by step
Verified Expert Solution
Question
1 Approved Answer
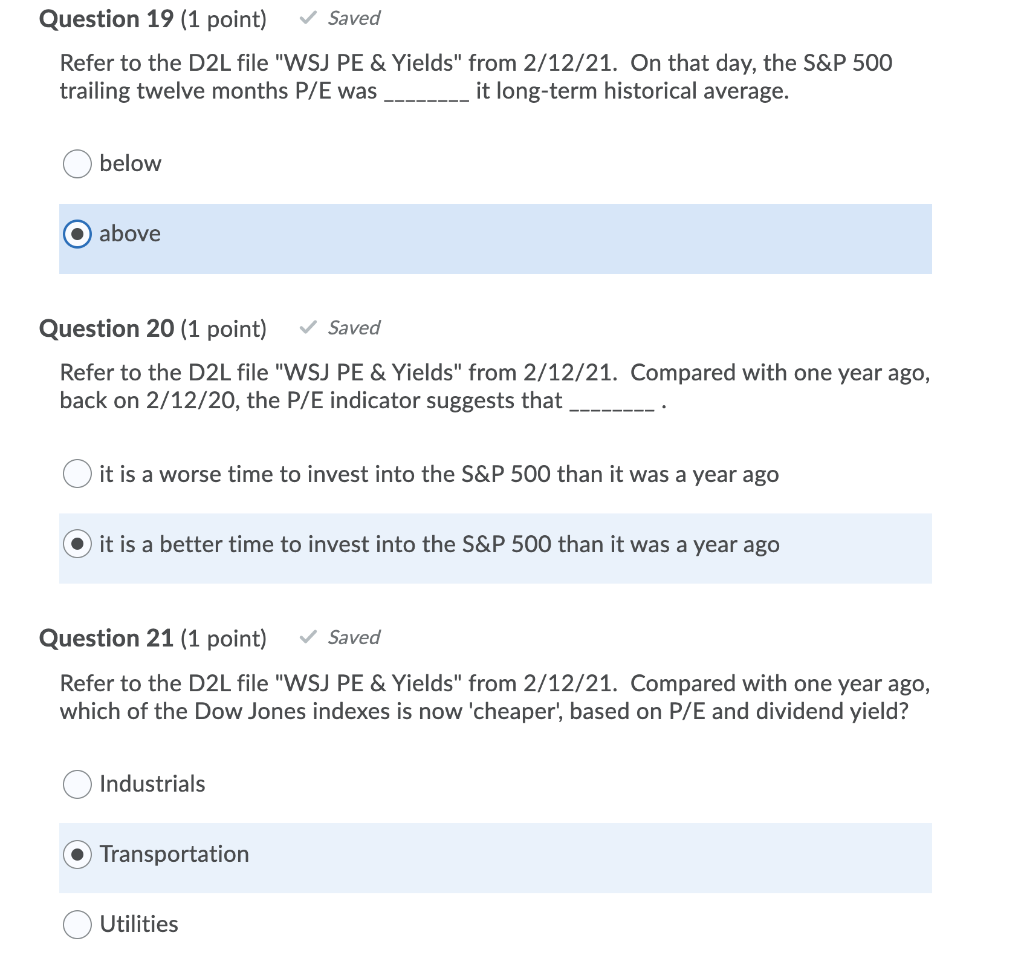
Can someone please helps me to check these three questions Question 19 (1 point) Saved Refer to the D2L file WSJ PE & Yields from


Can someone please helps me to check these three questions
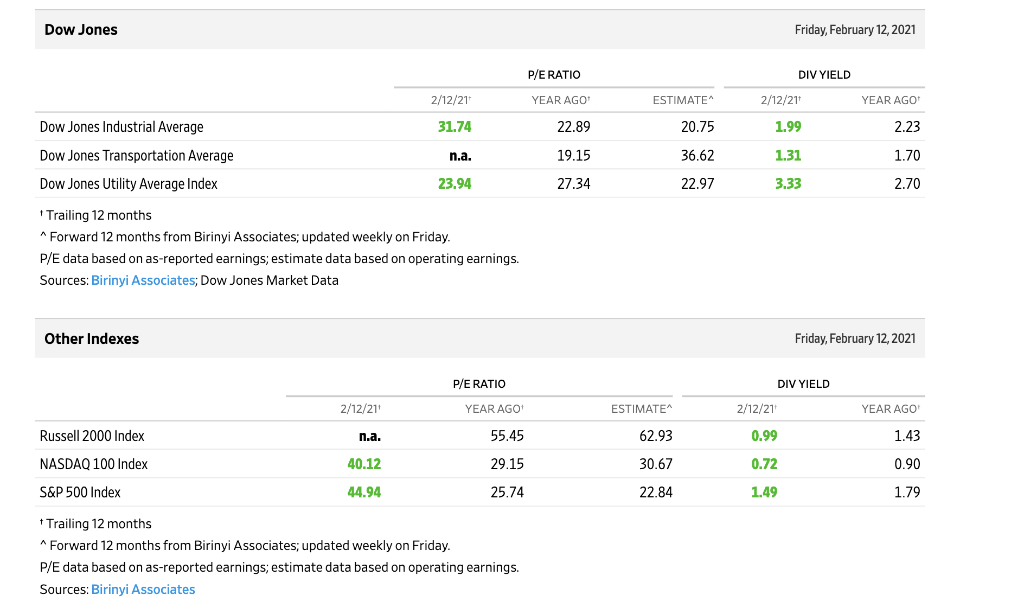
Question 19 (1 point) Saved Refer to the D2L file "WSJ PE & Yields" from 2/12/21. On that day, the S&P 500 trailing twelve months P/E was it long-term historical average. below O above Question 20 (1 point) Saved Refer to the D2L file "WSJ PE & Yields" from 2/12/21. Compared with one year ago, back on 2/12/20, the P/E indicator suggests that it is a worse time to invest into the S&P 500 than it was a year ago it is a better time to invest into the S&P 500 than it was a year ago Question 21 (1 point) Saved Refer to the D2L file "WSJ PE & Yields" from 2/12/21. Compared with one year ago, which of the Dow Jones indexes is now 'cheaper', based on P/E and dividend yield? Industrials Transportation Utilities Dow Jones Friday, February 12, 2021 P/E RATIO DIV YIELD 2/12/21 YEAR AGO ESTIMATE 2/12/21 YEAR AGO 22.89 20.75 1.99 2.23 19.15 36.62 1.31 1.70 27.34 22.97 3.33 2.70 Dow Jones Industrial Average 31.74 Dow Jones Transportation Average n.a. Dow Jones Utility Average Index 23.94 Trailing 12 months *Forward 12 months from Birinyi Associates; updated weekly on Friday. P/E data based on as-reported earnings; estimate data based on operating earnings. Sources: Birinyi Associates; Dow Jones Market Data Other Indexes Friday, February 12, 2021 P/E RATIO DIV YIELD 2/12/21 YEAR AGO ESTIMATE 2/12/21 YEAR AGO Russell 2000 Index n.a. 55.45 62.93 0.99 1.43 NASDAQ 100 Index 40.12 29.15 30.67 0.72 0.90 S&P 500 Index 44.94 25.74 22.84 1.49 1.79 * Trailing 12 months Forward 12 months from Birinyi Associates, updated weekly on Friday. P/E data based on as-reported earnings; estimate data based on operating earnings. Sources: Birinyi Associates Question 19 (1 point) Saved Refer to the D2L file "WSJ PE & Yields" from 2/12/21. On that day, the S&P 500 trailing twelve months P/E was it long-term historical average. below O above Question 20 (1 point) Saved Refer to the D2L file "WSJ PE & Yields" from 2/12/21. Compared with one year ago, back on 2/12/20, the P/E indicator suggests that it is a worse time to invest into the S&P 500 than it was a year ago it is a better time to invest into the S&P 500 than it was a year ago Question 21 (1 point) Saved Refer to the D2L file "WSJ PE & Yields" from 2/12/21. Compared with one year ago, which of the Dow Jones indexes is now 'cheaper', based on P/E and dividend yield? Industrials Transportation Utilities Dow Jones Friday, February 12, 2021 P/E RATIO DIV YIELD 2/12/21 YEAR AGO ESTIMATE 2/12/21 YEAR AGO 22.89 20.75 1.99 2.23 19.15 36.62 1.31 1.70 27.34 22.97 3.33 2.70 Dow Jones Industrial Average 31.74 Dow Jones Transportation Average n.a. Dow Jones Utility Average Index 23.94 Trailing 12 months *Forward 12 months from Birinyi Associates; updated weekly on Friday. P/E data based on as-reported earnings; estimate data based on operating earnings. Sources: Birinyi Associates; Dow Jones Market Data Other Indexes Friday, February 12, 2021 P/E RATIO DIV YIELD 2/12/21 YEAR AGO ESTIMATE 2/12/21 YEAR AGO Russell 2000 Index n.a. 55.45 62.93 0.99 1.43 NASDAQ 100 Index 40.12 29.15 30.67 0.72 0.90 S&P 500 Index 44.94 25.74 22.84 1.49 1.79 * Trailing 12 months Forward 12 months from Birinyi Associates, updated weekly on Friday. P/E data based on as-reported earnings; estimate data based on operating earnings. Sources: Birinyi AssociatesStep by Step Solution
There are 3 Steps involved in it
Step: 1

Get Instant Access to Expert-Tailored Solutions
See step-by-step solutions with expert insights and AI powered tools for academic success
Step: 2

Step: 3

Ace Your Homework with AI
Get the answers you need in no time with our AI-driven, step-by-step assistance
Get Started


