Can someone solve this question in Python?
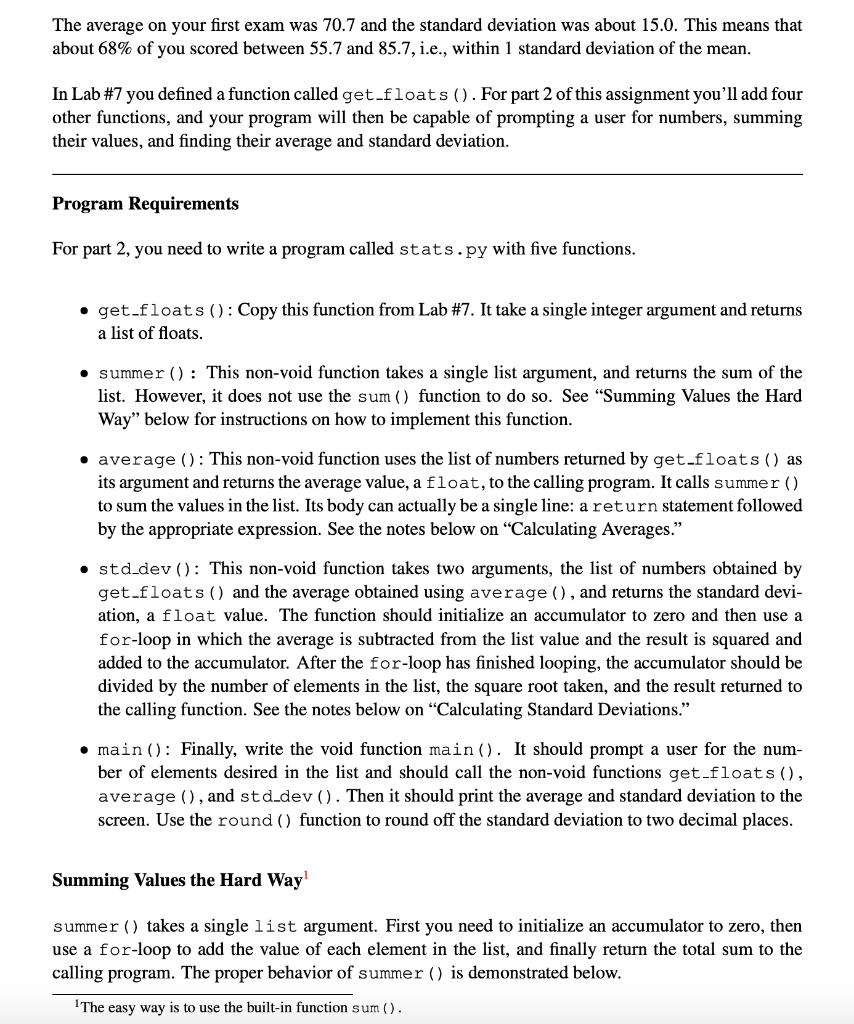
for-LooPS, FIBONACCI, AND A STATISTICS PROGRAM This assignment has two parts and isn't nearly as formidable as it looks (although you shouldn't wait until the last minute to start it). In the first part you'll have some fun with the Fibonacci sequence, and in the second part you'll actually create a statistics program you can use instead of your calculator (just joking). You must include a docstring in each function, use comments, and make your program readable by using whitespace effectively. You will be graded on all these aspects, not just on whether your programs run correctly. Header information. Your program must include the following information in the header Nam
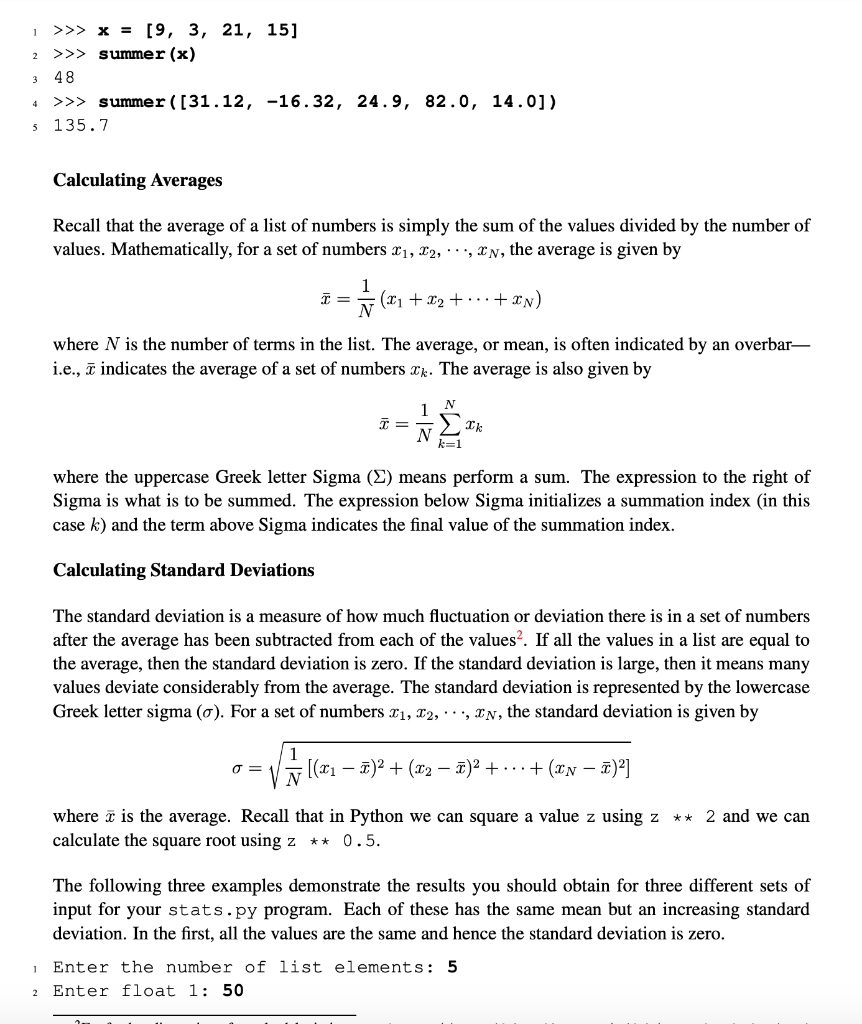
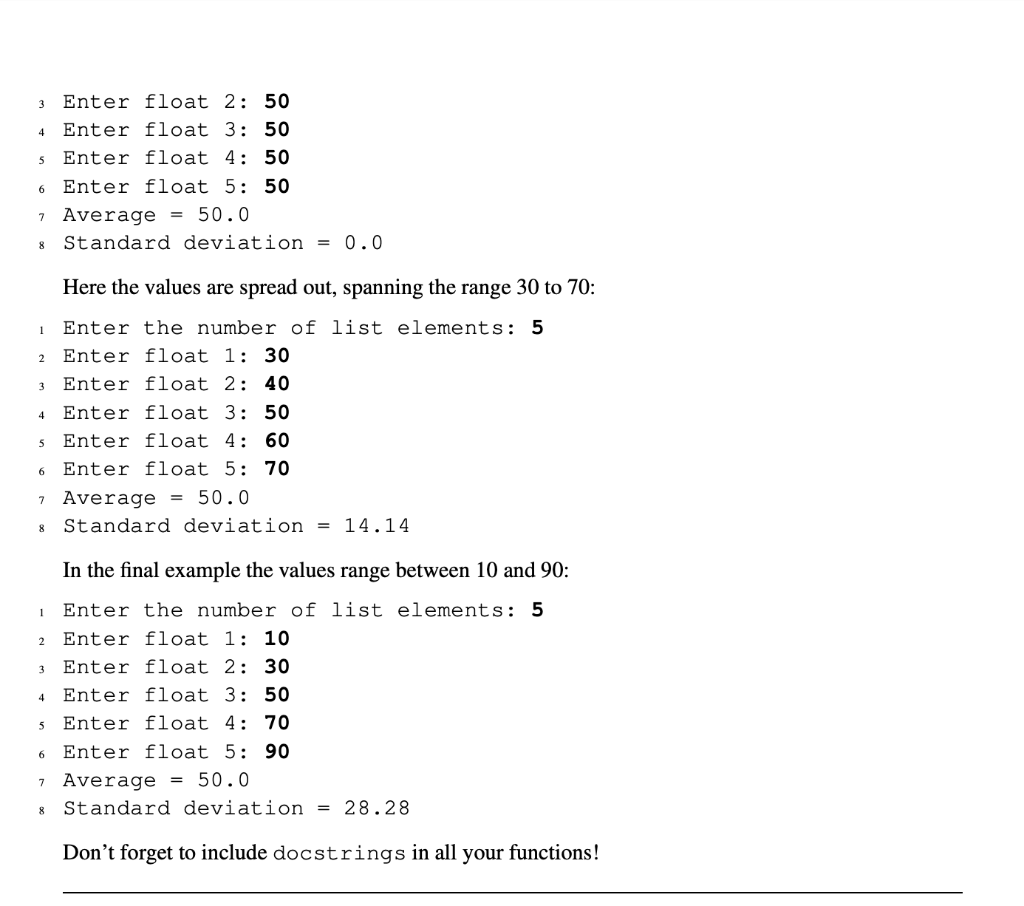
>x - [9, 3, 21, 15] 2 >>> summer(x) 48 >> summer ([31.12, -16.32, 24.9, 82.0, 14.0]) 135.7 Calculating Averages Recall that the average of a list of numbers is simply the sum of the values divided by the number of values. Mathematically, for a set of numbers xi, 2, . . ., the average is given by where N is the number of terms in the list. The average, or mean, is often indicated by an overbar i.e., indicates the average of a set of numbers xk. The average is also given by where the uppercase Greek letter Sigma () means perform a sum. The expression to the right of Sigma is what is to be summed. The expression below Sigma initializes a summation index (in this case k) and the term above Sigma indicates the final value of the summation index. Calculating Standard Deviations The standard deviation is a measure of how much fluctuation or deviation there is in a set of numbers after the average has been subtracted from each of the values2. If all the values in a list are equal to the average, then the standard deviation is zero. If the standard deviation is large, then it means many values deviate considerably from the average. The standard deviation is represented by the lowercase Greek letter sigma (). For a set of numbers , x2, . . ., xN, the standard deviation is given by where 7 is the average. Recall that in Python we can square a value z using z ** 2 and we can calculate the square root usingz ** 0.5 The following three examples demonstrate the results you should obtain for three different sets of input for your stats.py program. Each of these has the same mean but an increasing standard deviation. In the first, all the values are the same and hence the standard deviation is zero Enter the number of list elements: 5 2 Enter float 1: 50 Enter float 2: 50 4 Enter float 3: 50 s Enter float 4: 50 Enter float 5: 50 7 Average = 500 Standard deviation -0.0 Here the values are spread out, spanning the range 30 to 70 Enter the number of list elements: 5 2 Enter float 1: 30 Enter float 2: 40 4 Enter float 3: 50 s Enter float 4: 60 Enter float 5: 70 7 Average50.0 Standard deviation 14.14 In the final example the values range between 10 and 90: Enter the number of list elements: 5 2 Enter float 1: 10 Enter float 2: 30 4 Enter float 3: 50 s Enter float 4: 70 Enter float 5: 90 Standard deviation 28.28 Don't forget to include docstrings in all your functions! 7 Average- 50.0 for-LooPS, FIBONACCI, AND A STATISTICS PROGRAM This assignment has two parts and isn't nearly as formidable as it looks (although you shouldn't wait until the last minute to start it). In the first part you'll have some fun with the Fibonacci sequence, and in the second part you'll actually create a statistics program you can use instead of your calculator (just joking). You must include a docstring in each function, use comments, and make your program readable by using whitespace effectively. You will be graded on all these aspects, not just on whether your programs run correctly. Header information. Your program must include the following information in the header Nam>x - [9, 3, 21, 15] 2 >>> summer(x) 48 >> summer ([31.12, -16.32, 24.9, 82.0, 14.0]) 135.7 Calculating Averages Recall that the average of a list of numbers is simply the sum of the values divided by the number of values. Mathematically, for a set of numbers xi, 2, . . ., the average is given by where N is the number of terms in the list. The average, or mean, is often indicated by an overbar i.e., indicates the average of a set of numbers xk. The average is also given by where the uppercase Greek letter Sigma () means perform a sum. The expression to the right of Sigma is what is to be summed. The expression below Sigma initializes a summation index (in this case k) and the term above Sigma indicates the final value of the summation index. Calculating Standard Deviations The standard deviation is a measure of how much fluctuation or deviation there is in a set of numbers after the average has been subtracted from each of the values2. If all the values in a list are equal to the average, then the standard deviation is zero. If the standard deviation is large, then it means many values deviate considerably from the average. The standard deviation is represented by the lowercase Greek letter sigma (). For a set of numbers , x2, . . ., xN, the standard deviation is given by where 7 is the average. Recall that in Python we can square a value z using z ** 2 and we can calculate the square root usingz ** 0.5 The following three examples demonstrate the results you should obtain for three different sets of input for your stats.py program. Each of these has the same mean but an increasing standard deviation. In the first, all the values are the same and hence the standard deviation is zero Enter the number of list elements: 5 2 Enter float 1: 50 Enter float 2: 50 4 Enter float 3: 50 s Enter float 4: 50 Enter float 5: 50 7 Average = 500 Standard deviation -0.0 Here the values are spread out, spanning the range 30 to 70 Enter the number of list elements: 5 2 Enter float 1: 30 Enter float 2: 40 4 Enter float 3: 50 s Enter float 4: 60 Enter float 5: 70 7 Average50.0 Standard deviation 14.14 In the final example the values range between 10 and 90: Enter the number of list elements: 5 2 Enter float 1: 10 Enter float 2: 30 4 Enter float 3: 50 s Enter float 4: 70 Enter float 5: 90 Standard deviation 28.28 Don't forget to include docstrings in all your functions! 7 Average- 50.0